


THE COMPLETE PICTURE
>> Four indicators across three time frames.
>> When the Sherman Portfolios indicators are not all the same status, we read the market as being in a Mixed Market.
1. DELTA-V — Negative since April 4, 2025
2. GALACTIC SHIELD — Positive since April 1, 2023
3. STARFLUX— Negative since March 10, 2025
4. STARPATH — Negative since March 7, 2025
The shorter term picture:
>> GALACTIC SHIELD — POSITIVE, for Q2 2025. indicating positive prospects for equities in the second quarter of 2025. This indicator is based on the combination of U.S. and International Equities trend statuses at the start of each quarter.
>> STARFLUX— NEGATIVE, Starflux ended the week at -12.61 (down 48.53% last week) This short-term indicator measures U.S. Equities.
>> STARPATH — NEGATIVE, This indicator measures the interplay on dual timeframes of our Type 1s + the Russell 3000 + our four most ‘pro-cyclical’ Type 3s, vs. Cash.
The big picture:
The ‘big picture’ is the (typically) years-long timeframe, the same timeframe in which Cyclical Bulls and Bears operate.
>> The Sherman Portfolios DELTA-V Indicator measuring the Bull/Bear cycle finished the week in BEAR status at 42.15, down 7.12% from the prior week’s 45.38. It has signaled Bear since April 4, 2025.
>> The Sherman Portfolios DELTA-V Bond Indicator measuring the Bull/Bear cycle finished the week in BULL status at 62.54, up 5.73% from the prior week’s 59.15. It has signaled Bull since December 15, 2023.
THIS WEEK IN THE MARKETS
U.S. Markets:
Tariff announcement leads to stock market decline
Stocks experienced their steepest weekly decline in over five years following the Trump administration’s announcement of unexpectedly harsh tariffs, sparking fears of slower economic growth, rising inflation, and a potential recession. The Russell 2000 Index, representing small-cap stocks, plunged around 10% and closed the week more than 30% below its all-time high, while the S&P 500 suffered its worst weekly performance since the 2008 financial crisis. The market turmoil intensified after several countries, including China, responded with retaliatory tariffs and initiated negotiation plans, heightening concerns of a broader trade war. This uncertainty led to a surge in investor expectations for Federal Reserve interest rate cuts in 2025, as markets anticipated that the economic fallout would prompt the Fed to act to sustain growth and employment. On Friday, Fed Chair Jerome Powell acknowledged the heightened risks and inflationary pressures from the tariffs but emphasized that the effects remain uncertain and that the economy remains stable enough for the Fed to adopt a wait-and-see approach before making policy changes.
Looking at the US Indexes:
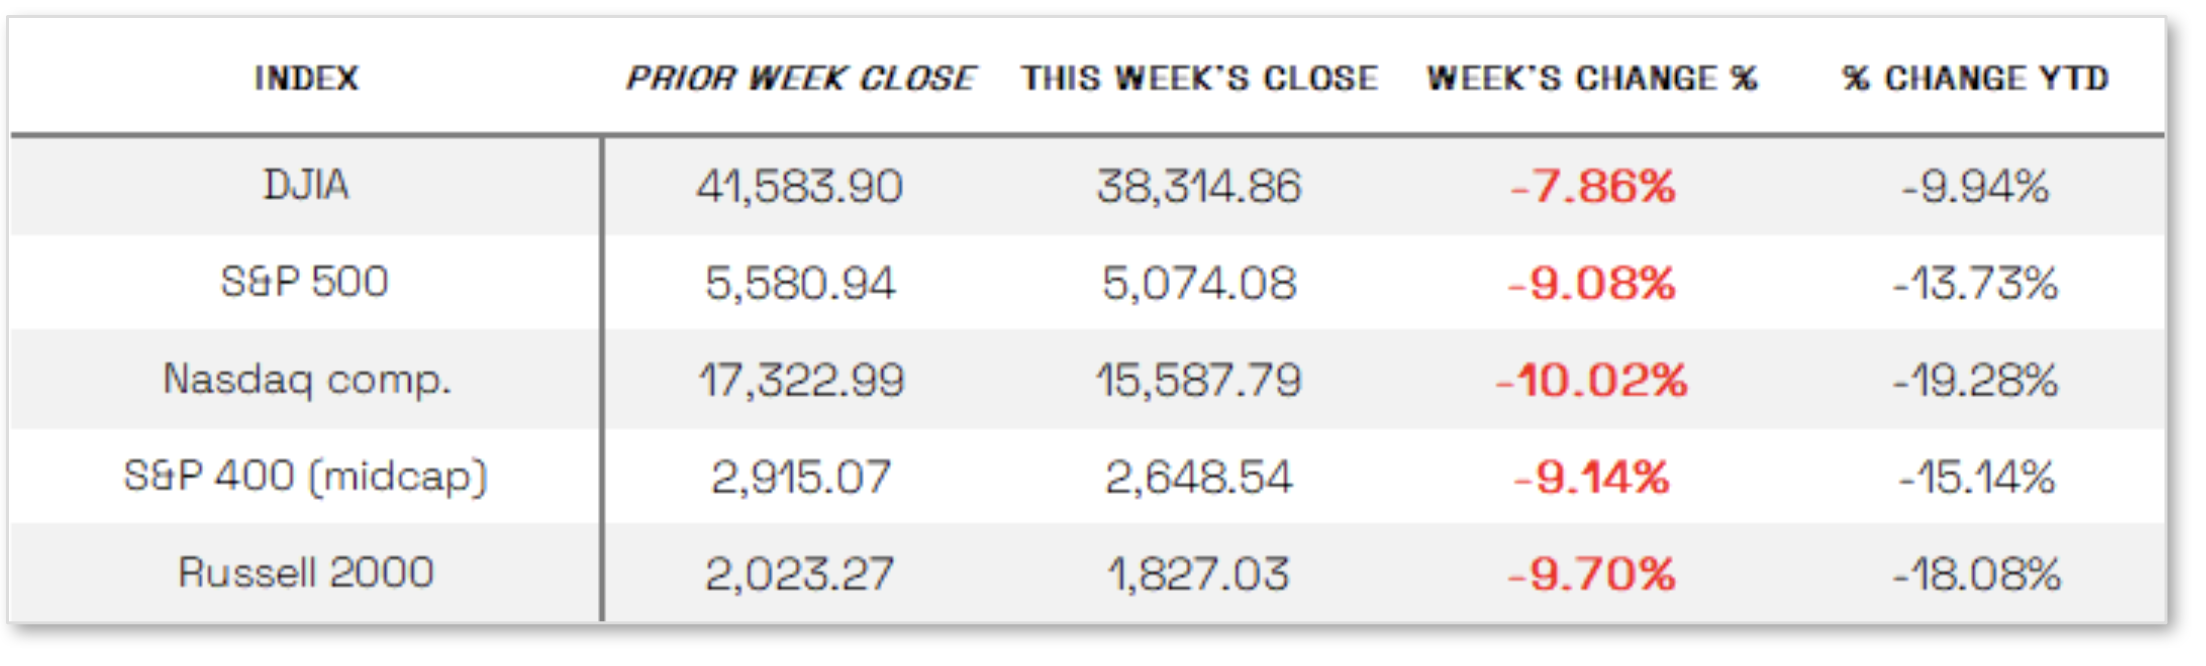
> The Dow Jones Industrial Average (DJIA) is the oldest continuing U.S. market index with over 100 years of history and is made up of 30 highly reputable “blue-chip” U.S. stocks (e.g. Coca-Cola Co., Microsoft). The Dow ended the week down 7.86% at 38,314.86 vs the prior week of 41,583.90.
> The Nasdaq Composite Index tracks most of the stocks listed on the Nasdaq Stock Market – the second-largest stock exchange in the world. Over half of all stocks on the NASDAQ are tech stocks. The tech-driven Nasdaq ended the week down 9.08%, closing at 15,587.79 vs. the prior week of 17,322.99.
> The S&P 500 large-cap index is a market-capitalization-weighted index of 500 leading publicly traded companies in the U.S. The S&P 500 is regarded as one of the best gauges of prominent American equities’ performance, and by extension, that of the stock market overall. The S&P 500 ended the week down 9.08%, closing at 5,074.08 compared to last week’s 5,580.94.
> The S&P 400 mid-cap index is the benchmark index made up of 400 stocks that broadly represent companies with midrange market capitalization between $3.6 billion and $13.1 billion. It is used by investors as a gauge for market performance and directional trends in U.S. stocks. The S&P 400 mid-cap ended the week down 9.14%, closing at 2,648.54 compared to last week’s 2,915.07.
> The Russell 2000 (RUT) small-cap index measures the performance of the 2,000 smaller companies included in the Russell 3000 Index. The Russell 2000 is managed by London’s FTSE Russell Group and is widely regarded as a leading indicator of the U.S. economy because of its focus on smaller companies that focus on the U.S. market. The Russell 2000 ended the week down 9.70%, closing at 2,648.54 compared to last week’s 2,023.27.
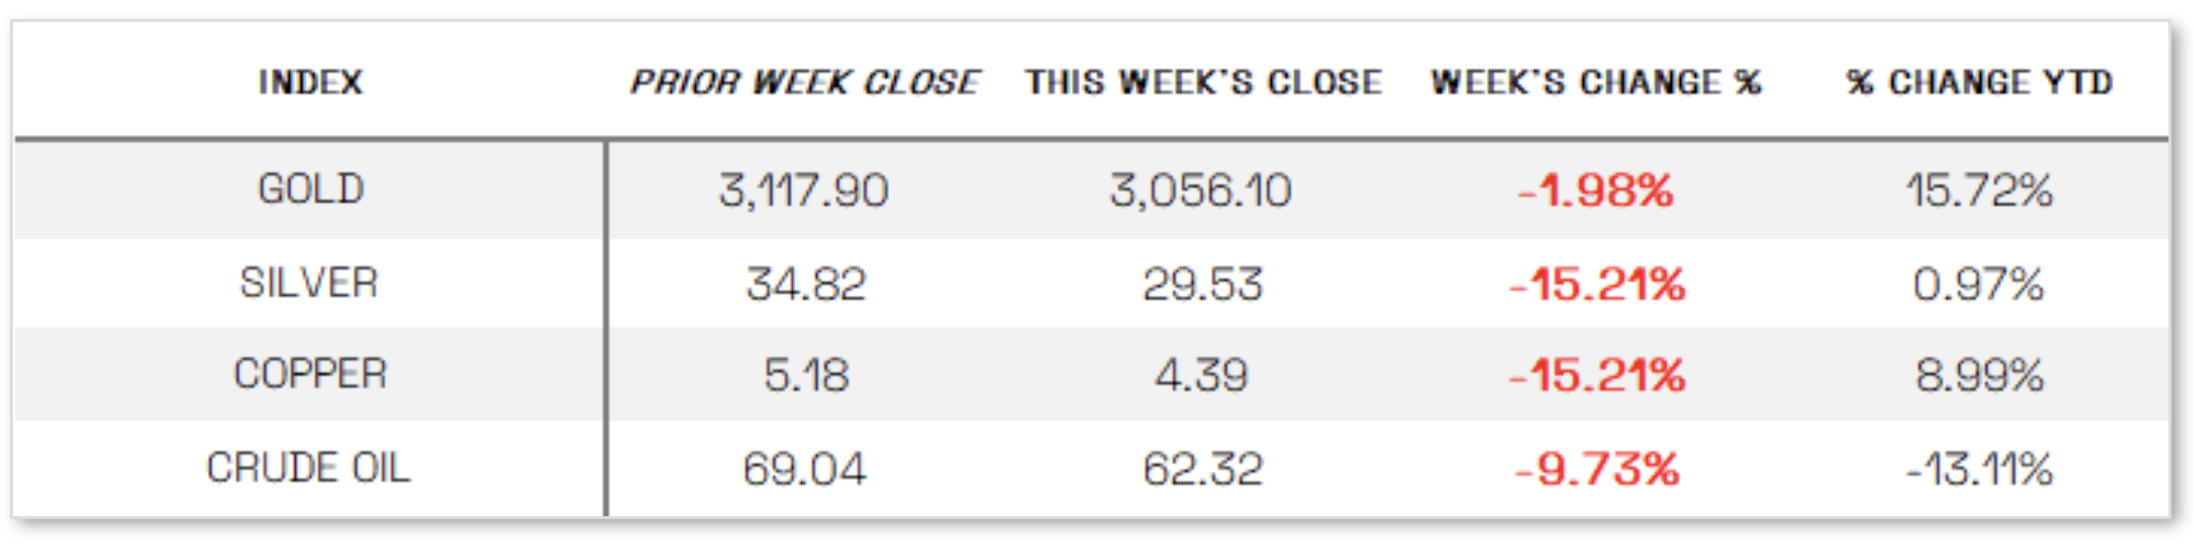
U.S. Commodities/Futures:
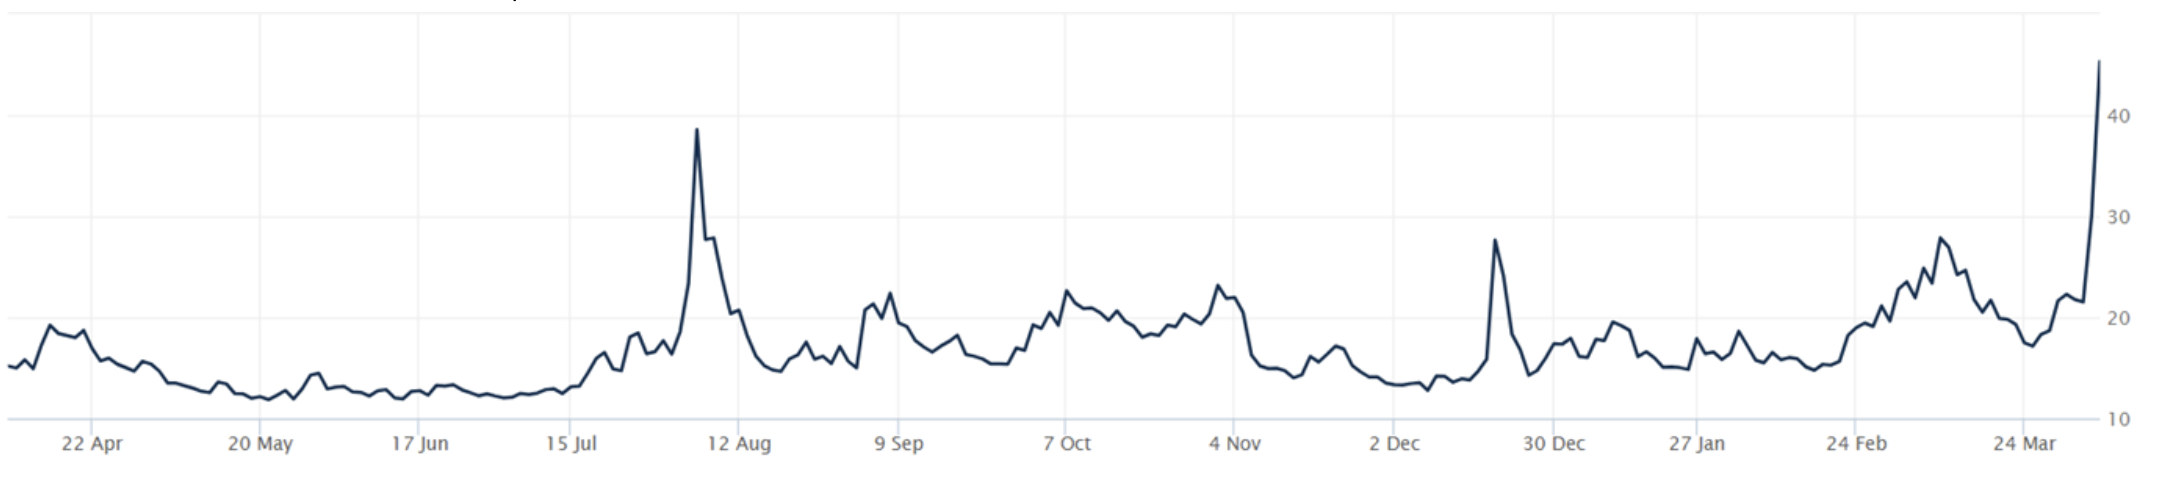
THE VOLATILITY INDEX (VIX) closed at 45.31 this week, a 109.3% increase vs last week’s close of 21.65
International Markets:
THIS WEEK’S ECONOMIC NEWS
U.S. Economic News:
Business growth down, Job growth up: Business activity growth showed signs of slowing in March as tariffs pushed prices higher, according to new data from the Institute for Supply Management (ISM). The ISM manufacturing PMI slipped back into contraction territory after two months of expansion, with new orders declining for a second straight month and the prices index surging to 69.4%—largely attributed to tariff-related cost increases. In contrast, the ISM services PMI indicated continued expansion in the services sector for the ninth consecutive month with a reading of 50.8%, though this marked a decline from February and fell short of expectations; notably, price pressures remained elevated, with many respondents citing tariffs as a key driver. Despite these inflationary headwinds, the U.S. labor market showed strength, as the Labor Department reported a sharp jump in nonfarm payrolls, with 228,000 jobs added in March—far exceeding forecasts and up from February’s revised total of 117,000—though the unemployment rate ticked up to 4.2%. While the strong job report pointed to underlying economic resilience, it did little to lift investor sentiment during the week, as concerns over the broader impact of escalating tariffs on future growth continued to dominate market focus.
International Economic News:
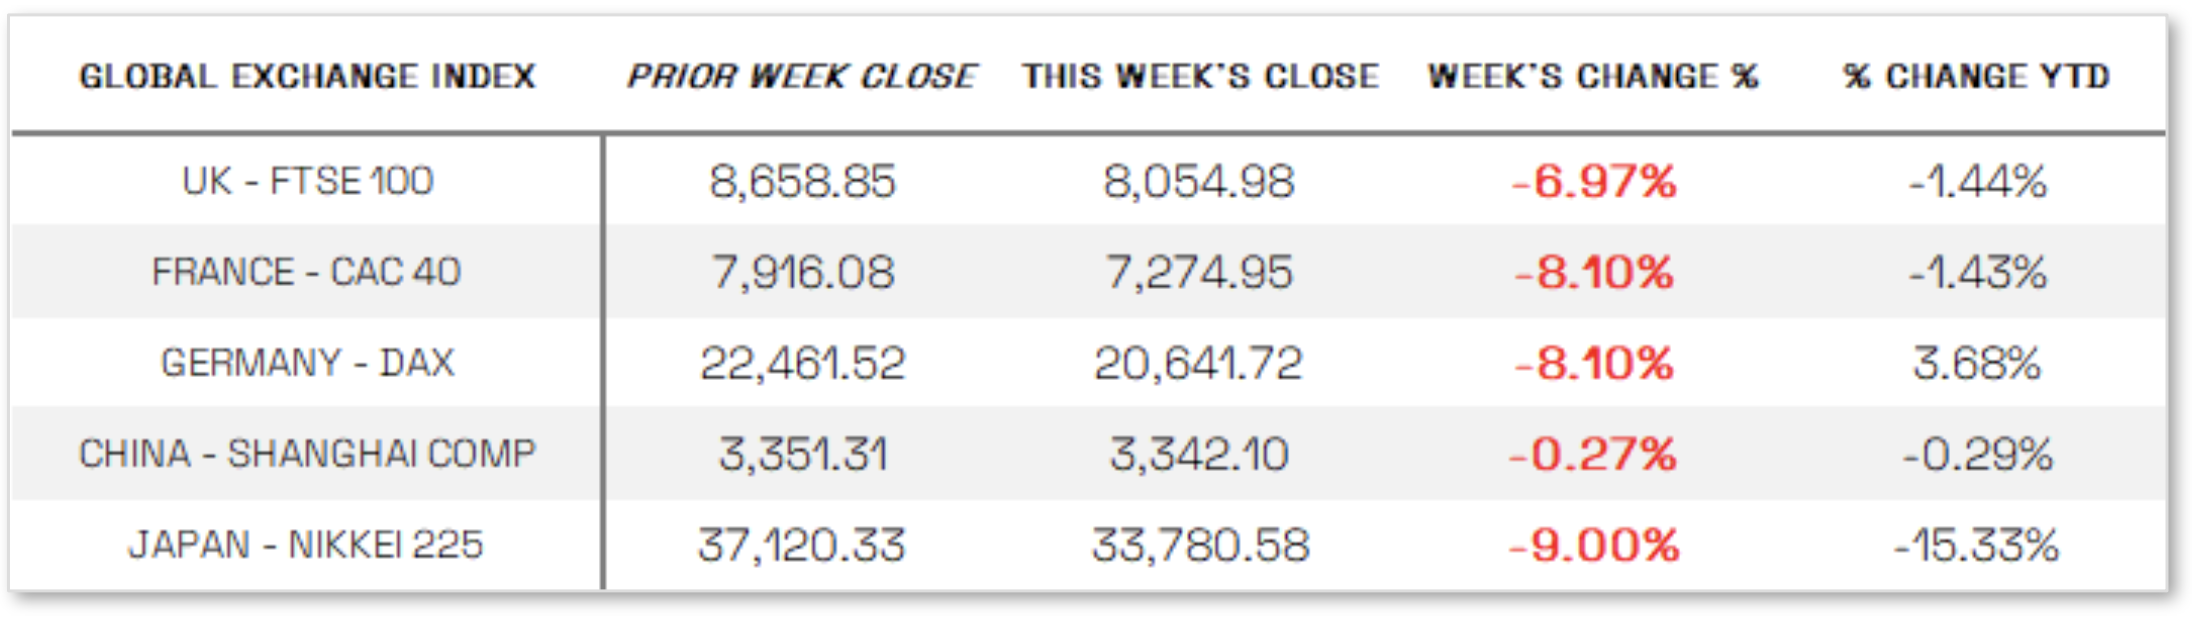
EUROPE: The pan-European STOXX Europe 600 Index dropped 8.44% in local currency terms—its steepest decline in five years—amid market turmoil sparked by higher-than-expected U.S. trade tariffs, with major indexes also tumbling: Italy’s FTSE MIB fell 10.56%, Germany’s DAX and France’s CAC 40 each slid 8.10%, and the UK’s FTSE 100 lost 6.97%. Amid the heightened uncertainty, Bloomberg reported that European Central Bank (ECB) policymakers are prepared to pause interest rate cuts, with hawkish members likely to hold firm and limited resistance expected from dovish officials. ECB President Christine Lagarde, speaking to Irish broadcaster Newstalk, stressed the need for caution on inflation amid trade tensions and noted that more progress is needed to reach the 2% inflation target, warning of the negative global impact of U.S. policies. Echoing this caution, Bank of Italy Governor Fabio Panetta urged restraint on easing borrowing costs, while Bank of Greece Governor Yannis Stournaras maintained that the tariffs would have only a limited effect on growth and should not prevent a rate cut in April. Nonetheless, following President Trump’s speech, market expectations for an April ECB rate cut surged to 90%, with a move fully priced in by June.
JAPAN: Japanese stock markets tumbled over the week as investors reacted to the Trump administration’s announcement of a 10% tariff on all U.S. imports and a larger-than-expected 24% reciprocal tariff on Japan, with the Nikkei 225 Index falling 9% and the broader TOPIX Index down 10%. Japanese banks, sensitive to interest rate changes, led the sell-off amid a sharp drop in government bond yields, as the 10-year JGB yield fell to 1.18% from 1.56%. Carmakers also continued to underperform due to previously announced 25% U.S. auto tariffs, from which Japan is still seeking exemptions. Global risk aversion boosted demand for safe-haven assets, driving the yen stronger to the low end of the JPY 146 range against the dollar, further pressuring Japan’s export-heavy sectors. Growing uncertainty over the impact of tariffs fueled expectations that the Bank of Japan may delay its next interest rate hike, with Governor Kazuo Ueda noting that tariffs could dampen growth and increase economic uncertainty both globally and domestically. While the effects on inflation remain unclear—potentially lowering prices through slower growth or raising them via supply disruptions—Ueda emphasized that the BoJ will carefully assess the situation and adjust policy accordingly, maintaining its base case to raise rates if economic projections are met while acknowledging the risks posed by escalating trade tensions.
CHINA: Mainland Chinese stock markets declined during a holiday-shortened week, with the CSI 300 Index falling 1.37% and the Shanghai Composite Index slipping 0.28% in local currency terms, while Hong Kong’s Hang Seng Index retreated 2.46%; markets were closed Friday for the Qingming Festival. The downturn followed the Trump administration’s announcement of a 34% tariff hike on Chinese goods, prompting an immediate and sweeping response from Beijing, which announced a matching 34% tariff on all U.S. imports starting April 10 along with a series of other retaliatory measures. These included restrictions on rare earth exports, an antidumping probe into U.S.-made CT X-ray tubes, import bans on poultry and sorghum from selected U.S. firms, and the addition of 11 American defense companies to China’s “unreliable entity” list. The rapid and extensive retaliation, announced by multiple government ministries, surprised some analysts who had expected a more restrained approach. Bloomberg reported that the new U.S. tariffs would raise duties on nearly all Chinese products to at least 54%, potentially reducing China’s annual GDP by 1% to 2%, according to T. Rowe Price economists. However, they believe the Chinese government has ample capacity to offset the economic impact and is likely to introduce more fiscal stimulus in phases as it gauges the effects of the tariffs and the potential for future negotiations.
Sources:
>> All index and returns data from Norgate Data and Commodity Systems Incorporated and Wall Street Journal.
>> News from Reuters, Barron’s, Wall St. Journal, Bloomberg.com, ft.com, guggenheimpartners.com, zerohedge.com, ritholtz.com, markit.com, financialpost.com, Eurostat, Statistics Canada, Yahoo! Finance, stocksandnews.com, marketwatch.com, visualcapitalist.com, wantchinatimes.com, BBC, 361capital.com, pensionpartners.com, cnbc.com, FactSet, Morningstar/Ibbotson Associates, Corporate Finance Institute.
>> Commentary from T Rowe Price Global markets weekly update — https://www.troweprice.com/personal-investing/resources/insights/global-markets-weekly-update.html
Disclosures: This material and any mention of specific investments is provided for informational purposes only and is not intended to be investment advice or a recommendation to take any action. The forecasts or forward-looking statements are based on assumptions, may not materialize, and are subject to revision without notice. The market indexes discussed are unmanaged, and generally, considered representative of their respective markets. Index performance is not indicative of the past performance of a particular investment. Indexes do not incur management fees, costs, and expenses. Individuals cannot directly invest in unmanaged indexes. Past performance does not guarantee future results.
