


THE COMPLETE PICTURE
>> Four indicators across three time frames.
>> When the Sherman Portfolios indicators are not all the same status, we read the market as being in a Mixed Market.
1. DELTA-V — Positive since April 21, 2023
2. GALACTIC SHIELD — Positive since April 1, 2023
3. STARFLUX— Negative since March 10, 2025
4. STARPATH — Negative since March 7, 2025
The shorter term picture:
>> GALACTIC SHIELD — POSITIVE, for Q1 2025, indicating positive prospects for equities in the first quarter of 2025. This indicator is based on the combination of U.S. and International Equities trend statuses at the start of each quarter.
>> STARFLUX— NEGATIVE, Starflux ended the week at -8.49 (down 21.46% last week) This short-term indicator measures U.S. Equities.
>> STARPATH — NEGATIVE, This indicator measures the interplay on dual timeframes of our Type 1s + the Russell 3000 + our four most ‘pro-cyclical’ Type 3s, vs. Cash.
The big picture:
The ‘big picture’ is the (typically) years-long timeframe, the same timeframe in which Cyclical Bulls and Bears operate.
>> The Sherman Portfolios DELTA-V Indicator measuring the Bull/Bear cycle finished the week in BULL status at 45.38, down 5.65% from the prior week’s 48.10. It has signaled Bull since April 21, 2023.
>> The Sherman Portfolios DELTA-V Bond Indicator measuring the Bull/Bear cycle finished the week in BULL status at 59.15, down 3.73% from the prior week’s 61.44. It has signaled Bull since December 15, 2023.
THIS WEEK IN THE MARKETS
U.S. Markets:
Stocks down over Trade Concerns:
U.S. stock indexes declined over the week, led by weakness in the information technology and communication services sectors, while value stocks outperformed growth shares for the sixth consecutive week. Markets started with cautious optimism as investors speculated on a more measured approach to tariffs by the Trump administration, but sentiment shifted following new tariff announcements, including a 25% levy on non-U.S.-made automobiles, fueling concerns about economic slowdown and weakening consumer sentiment. Further pressure came from inflation data, as the Bureau of Economic Analysis reported a rise in the core personal consumption expenditures (PCE) price index to 2.8% year-over-year, exceeding the Fed’s 2% target, while inflation-adjusted consumer spending grew only 0.1%, missing estimates. These factors contributed to a broad market selloff, pushing major indexes into negative territory and ending the week near their lowest levels.
Looking at the US Indexes:
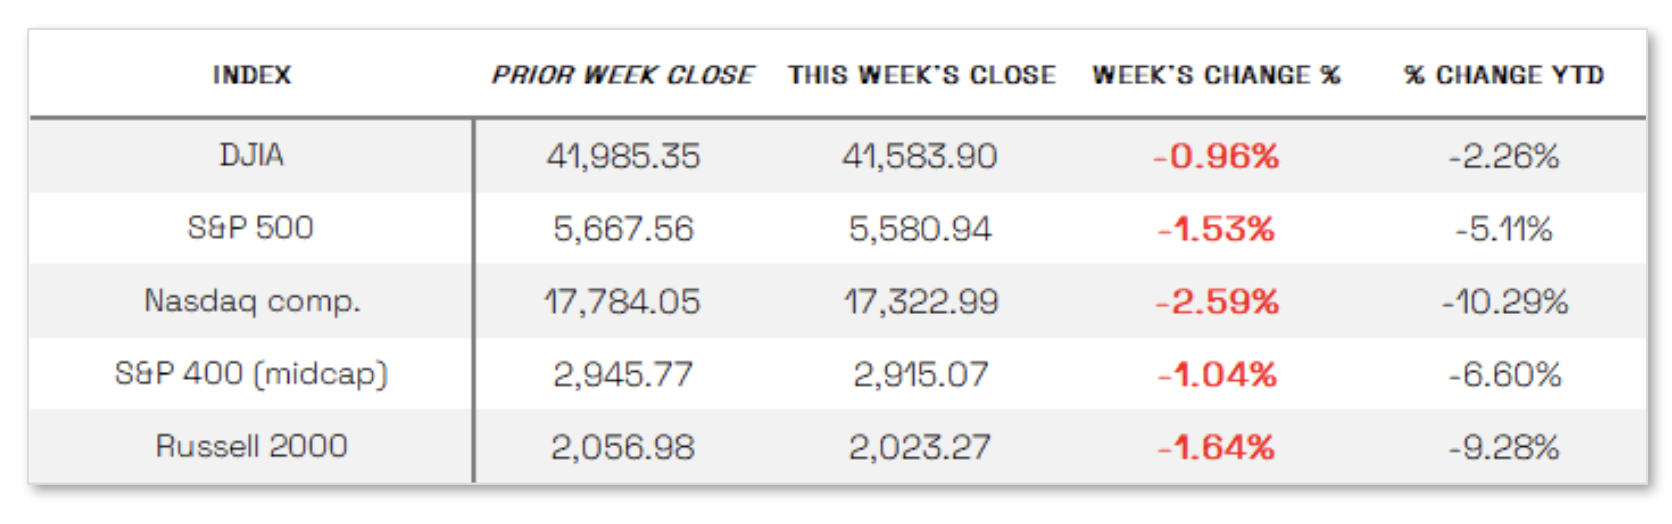
> The Dow Jones Industrial Average (DJIA) is the oldest continuing U.S. market index with over 100 years of history and is made up of 30 highly reputable “blue-chip” U.S. stocks (e.g. Coca-Cola Co., Microsoft). The Dow ended the week down 0.96% at 41,583.90 vs the prior week of 41,985.35.
> The Nasdaq Composite Index tracks most of the stocks listed on the Nasdaq Stock Market – the second-largest stock exchange in the world. Over half of all stocks on the NASDAQ are tech stocks. The tech-driven Nasdaq ended the week down 2.59%, closing at 17,322.99 vs. the prior week of 17,784.05.
> The S&P 500 large-cap index is a market-capitalization-weighted index of 500 leading publicly traded companies in the U.S. The S&P 500 is regarded as one of the best gauges of prominent American equities’ performance, and by extension, that of the stock market overall. The S&P 500 ended the week down 1.53%, closing at 5,580.94 compared to last week’s 5,667.56.
> The S&P 400 mid-cap index is the benchmark index made up of 400 stocks that broadly represent companies with midrange market capitalization between $3.6 billion and $13.1 billion. It is used by investors as a gauge for market performance and directional trends in U.S. stocks. The S&P 400 mid-cap ended the week down 1.04%, closing at 2,915.07 compared to last week’s 2,945.77.
> The Russell 2000 (RUT) small-cap index measures the performance of the 2,000 smaller companies included in the Russell 3000 Index. The Russell 2000 is managed by London’s FTSE Russell Group and is widely regarded as a leading indicator of the U.S. economy because of its focus on smaller companies that focus on the U.S. market. The Russell 2000 ended the week down 1.64%, closing at 2,023.27 compared to last week’s 2,056.98.
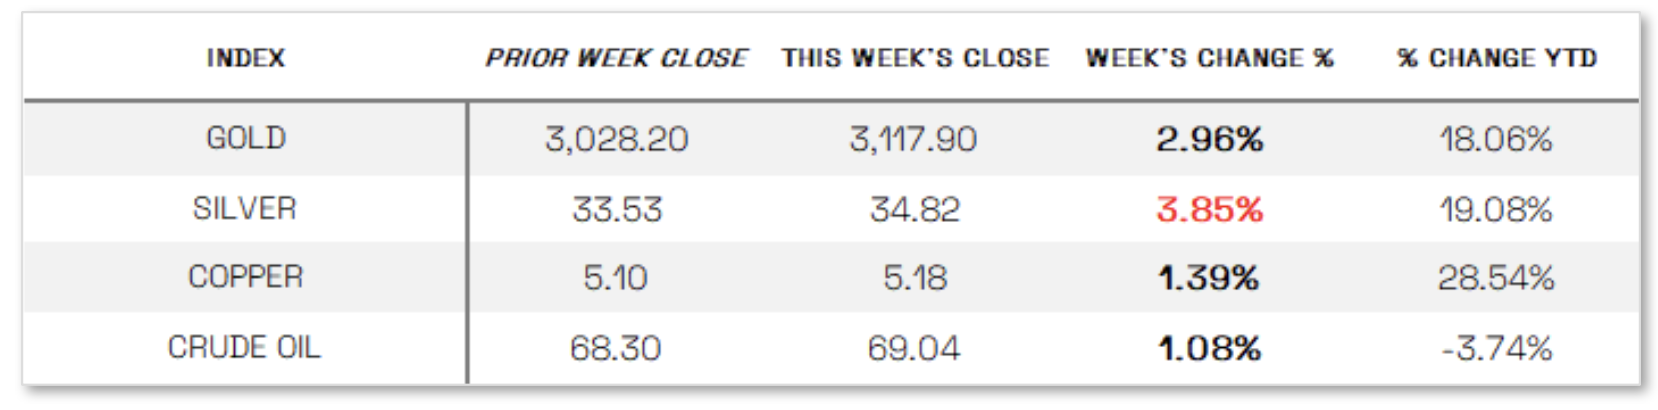
U.S. Commodities/Futures:
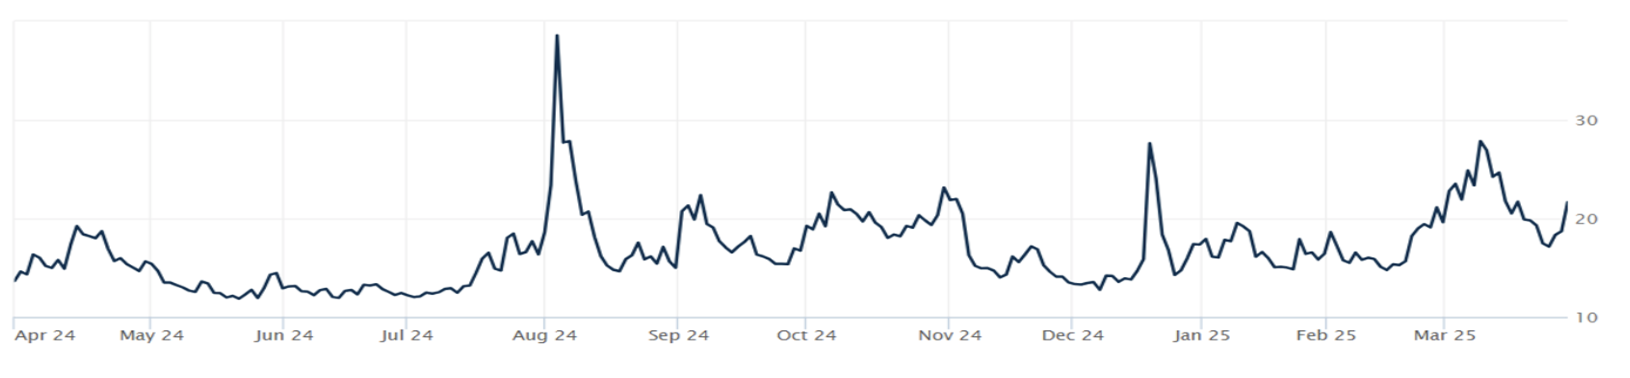
THE VOLATILITY INDEX (VIX) closed at 21.65 this week, a 12.3% increase vs last week’s close of 19.28.
International Markets:
THIS WEEK’S ECONOMIC NEWS
U.S. Economic News:
Consumer Confidence Down: Consumer confidence continued to decline in March, with the Conference Board’s index falling for the fourth consecutive month to 92.9, while its expectations component dropped to 65.2, a 12-year low, signaling potential recessionary risks. The University of Michigan’s Consumer Sentiment Index also fell 12% to 57.0, with expectations plunging 18% amid growing concerns over economic policy, while year-ahead inflation expectations rose to 5.0%, the highest since November 2022. Meanwhile, business activity accelerated, as S&P Global’s Flash Composite PMI reached 53.5, driven by strength in the services sector, though future outlooks deteriorated to their second-lowest level since October 2022 due to concerns over demand and policy uncertainty. Additionally, input prices surged at the fastest rate in nearly two years, driven by tariffs and rising labor costs.
International Economic News:
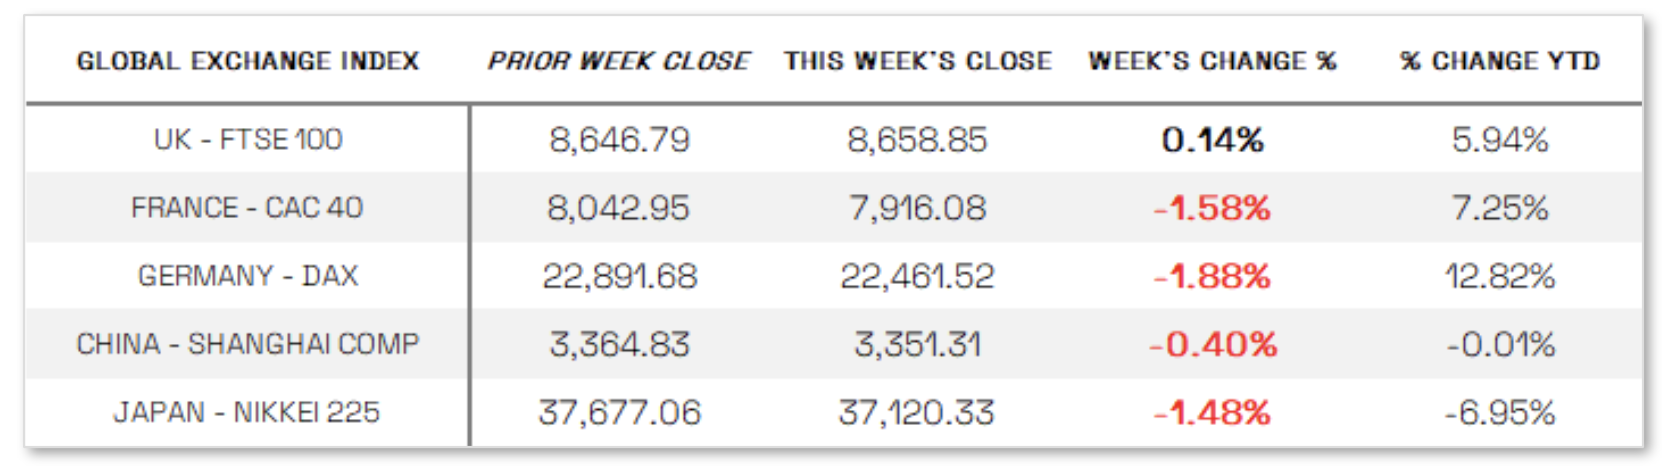
EUROPE: European stocks ended the week lower, with the STOXX Europe 600 Index falling 1.4% as market optimism faded following Trump’s announcement of fresh 25% U.S. tariffs on all imported autos and auto parts, dashing hopes of exemptions and raising fears of retaliatory measures from the EU. France’s CAC 40 lost 1.58%, and Germany’s DAX dropped 1.88%, while the UK’s FTSE 100 managed a slight 0.14% gain. Despite the market downturn, economic data offered some optimism, as the eurozone private sector expanded for the third consecutive month, with manufacturing production growing for the first time in two years. Germany’s Ifo Business Climate Index reached its highest level since July 2024, bolstered by parliamentary approval of increased defense and infrastructure spending. Geopolitical developments also provided a positive backdrop, with Ukraine and the U.S. reporting constructive talks and a partial ceasefire agreement between Russia and Ukraine easing tensions in the Black Sea. In the UK, Chancellor Rachel Reeves announced further spending cuts in the Spring Statement, while the Office for Budget Responsibility halved its 2025 growth forecast to 1% but upgraded projections for 2026–2029. Lower-than-expected UK inflation in February at 2.8%, down from 3% in January, kept hopes alive for a potential interest rate cut in May.
JAPAN: Japan’s stock markets declined over the week, with the Nikkei 225 falling 1.48% and the TOPIX Index losing 1.67%, as the Trump administration’s announcement of a 25% tariff on auto imports into the U.S., effective April 3, weighed on Japanese automakers and exporters. Concerns over a potential trade war and retaliatory tariffs further dampened investor sentiment. The yen weakened to the mid-JPY 150 range against the U.S. dollar from the previous week’s JPY 149.3, amid expectations that the Bank of Japan might delay its next interest rate hike. Prime Minister Shigeru Ishiba warned that the tariffs could have a significant impact on Japan’s auto industry, which accounts for about one-third of the country’s exports to the U.S., and emphasized that all response options were being considered. The Japanese government is actively seeking an exemption from the tariffs through diplomatic efforts, including increased investments and energy purchases.
CHINA: Mainland Chinese stock markets ended the week largely unchanged amid a light economic calendar and corporate earnings that met expectations, with the CSI 300 Index edging up 0.01% and the Shanghai Composite Index declining 0.40%, while Hong Kong’s Hang Seng Index fell 1.11%. Industrial profits shrank 0.3% year-over-year in the first two months, missing forecasts and highlighting the need to strengthen domestic demand amid the threat of higher U.S. tariffs. A former vice chair of China’s state economic planner suggested increasing consumption to 70% of GDP by 2035 from the current 55%, with a targeted 5% to 8% rise over the next five years. Boosting consumption remains the Chinese government’s top priority for 2025, as it aims to offset geopolitical risks and slowing investment returns, while its 5% annual growth target for the third consecutive year is seen as ambitious and likely to require substantial stimulus.
Sources:
All index and returns data from Norgate Data and Commodity Systems Incorporated and Wall Street Journal.
>> News from Reuters, Barron’s, Wall St. Journal, Bloomberg.com, ft.com, guggenheimpartners.com, zerohedge.com, ritholtz.com, markit.com, financialpost.com, Eurostat, Statistics Canada, Yahoo! Finance, stocksandnews.com, marketwatch.com, visualcapitalist.com, wantchinatimes.com, BBC, 361capital.com, pensionpartners.com, cnbc.com, FactSet, Morningstar/Ibbotson Associates, Corporate Finance Institute.
>> Commentary from T Rowe Price Global markets weekly update — https://www.troweprice.com/personal-investing/resources/insights/global-markets-weekly-update.html
Disclosures: This material and any mention of specific investments is provided for informational purposes only and is not intended to be investment advice or a recommendation to take any action. The forecasts or forward-looking statements are based on assumptions, may not materialize, and are subject to revision without notice. The market indexes discussed are unmanaged, and generally, considered representative of their respective markets. Index performance is not indicative of the past performance of a particular investment. Indexes do not incur management fees, costs, and expenses. Individuals cannot directly invest in unmanaged indexes. Past performance does not guarantee future results.
