


THE COMPLETE PICTURE
>> Four indicators across three time frames.
>> When the Sherman Portfolios indicators are not all the same status, we read the market as being in a Mixed Market.
1. DELTA-V — Positive since April 21, 2023
2. GALACTIC SHIELD — Positive since April 1, 2023
3. STARFLUX— Negative since March 10, 2025
4. STARPATH — Negative since March 7, 2025
The shorter term picture:
>> GALACTIC SHIELD — POSITIVE, for Q1 2025, indicating positive prospects for equities in the first quarter of 2025. This indicator is based on the combination of U.S. and International Equities trend statuses at the start of each quarter.
>> STARFLUX— NEGATIVE, Starflux ended the week at -6.99 (up 8.15% last week) This short-term indicator measures U.S. Equities.
>> STARPATH — NEGATIVE, This indicator measures the interplay on dual timeframes of our Type 1s + the Russell 3000 + our four most ‘pro-cyclical’ Type 3s, vs. Cash.
The big picture:
The ‘big picture’ is the (typically) years-long timeframe, the same timeframe in which Cyclical Bulls and Bears operate.
>> The Sherman Portfolios DELTA-V Indicator measuring the Bull/Bear cycle finished the week in BULL status at 48.10, down 3.99% from the prior week’s 50.10. It has signaled Bull since April 21, 2023.
>> The Sherman Portfolios DELTA-V Bond Indicator measuring the Bull/Bear cycle finished the week in BULL status at 61.44, up 0.59% from the prior week’s 61.08. It has signaled Bull since December 15, 2023.
THIS WEEK IN THE MARKETS
U.S. Markets:
Slight gains in quiet week:
U.S. stocks ended the week higher, breaking multi-week declines, with the Dow Jones Industrial Average leading gains at 1.2% and the S&P MidCap 400 securing its first weekly rise since January. However, large-cap tech stocks lagged, dragging down the Nasdaq Composite, which was the worst-performing index. Value stocks outpaced growth for the fifth straight week, extending their year-to-date lead to 8.97 percentage points, as measured by Russell 1000 indexes. Trading volumes remained light, hitting the lowest daily levels of the year on Thursday, as investors processed policy shifts, economic forecasts, and geopolitical uncertainties.
Looking at the US Indexes:
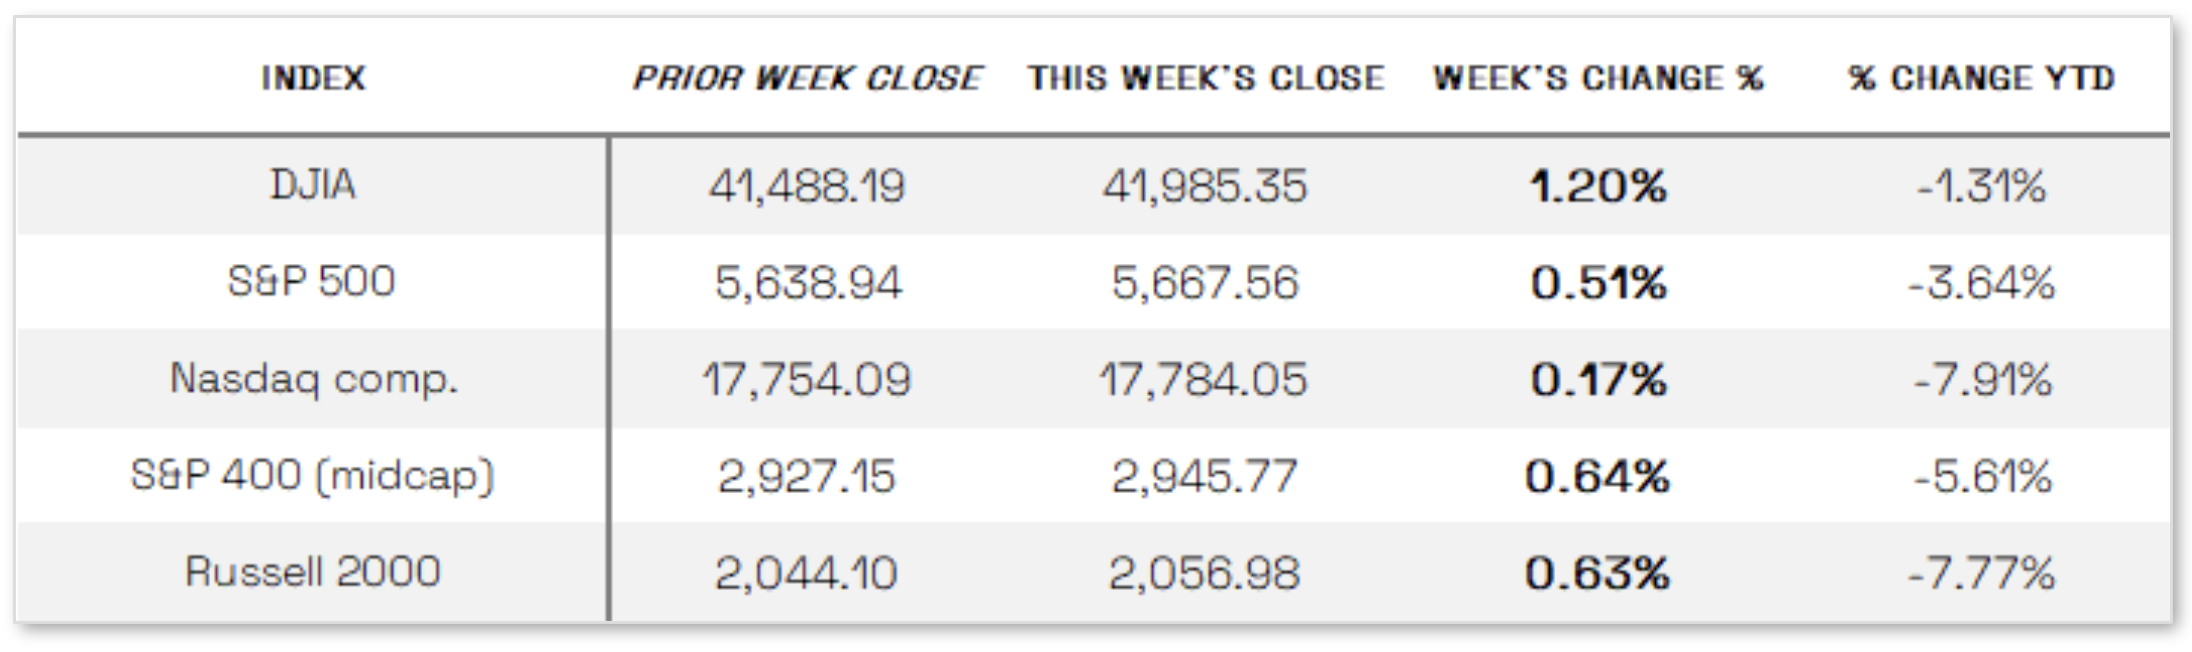
> The Dow Jones Industrial Average (DJIA) is the oldest continuing U.S. market index with over 100 years of history and is made up of 30 highly reputable “blue-chip” U.S. stocks (e.g. Coca-Cola Co., Microsoft). The Dow ended the week up 1.20% at 41,985.35 vs the prior week of 41,488.19.
> The Nasdaq Composite Index tracks most of the stocks listed on the Nasdaq Stock Market – the second-largest stock exchange in the world. Over half of all stocks on the NASDAQ are tech stocks. The tech-driven Nasdaq ended the week up 0.17%, closing at 17,784.05 vs. the prior week of 17,754.09.
> The S&P 500 large-cap index is a market-capitalization-weighted index of 500 leading publicly traded companies in the U.S. The S&P 500 is regarded as one of the best gauges of prominent American equities’ performance, and by extension, that of the stock market overall. The S&P 500 ended the week up 0.51%, closing at 5,667.56 compared to last week’s 5,638.94.
> The S&P 400 mid-cap index is the benchmark index made up of 400 stocks that broadly represent companies with midrange market capitalization between $3.6 billion and $13.1 billion. It is used by investors as a gauge for market performance and directional trends in U.S. stocks. The S&P 400 mid-cap ended the week up 0.64%, closing at 2,945.77 compared to last week’s 2,927.15.
> The Russell 2000 (RUT) small-cap index measures the performance of the 2,000 smaller companies included in the Russell 3000 Index. The Russell 2000 is managed by London’s FTSE Russell Group and is widely regarded as a leading indicator of the U.S. economy because of its focus on smaller companies that focus on the U.S. market. The Russell 2000 ended the week up 0.63%, closing at 2,056.98 compared to last week’s 2,044.10.
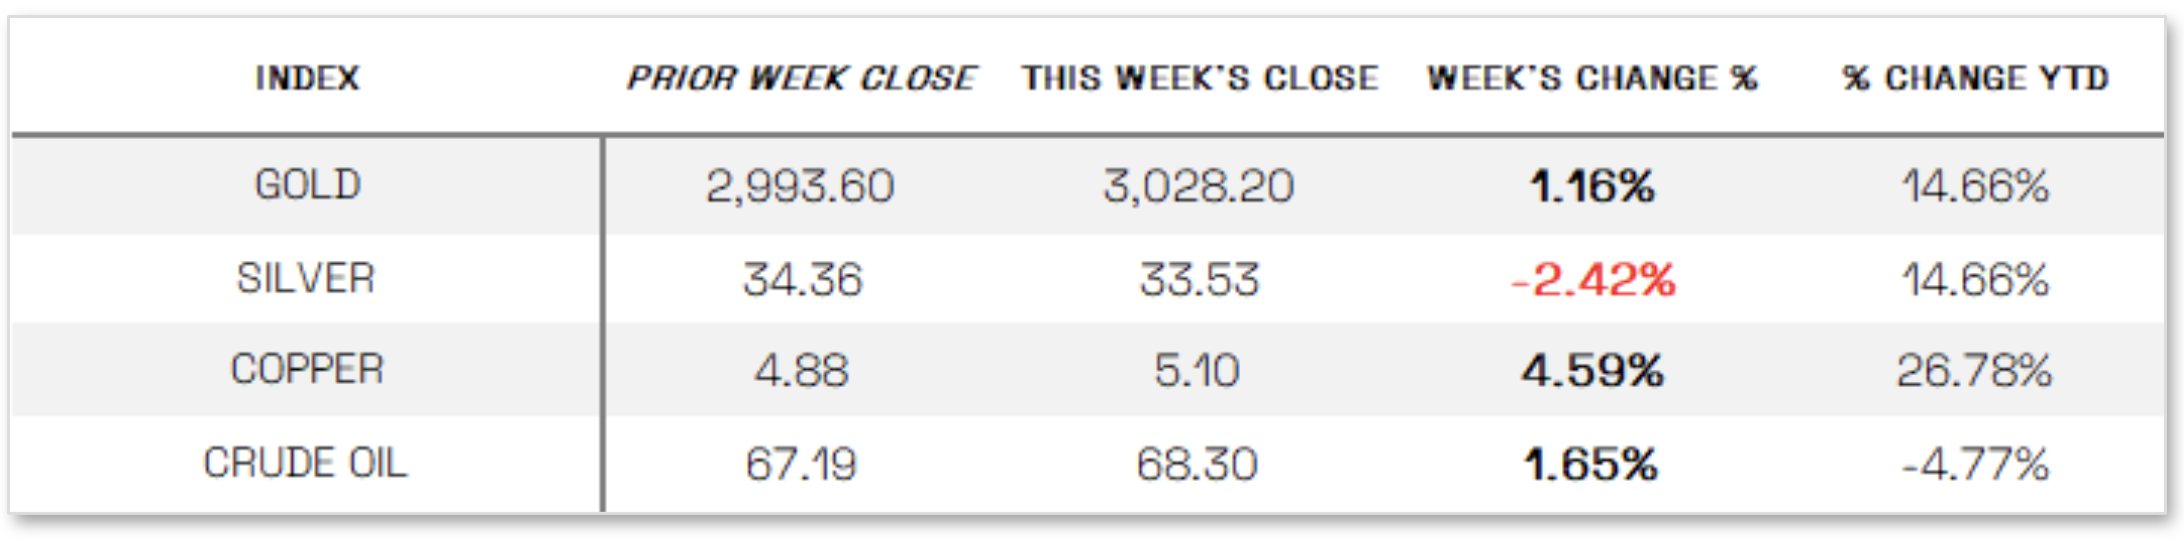
U.S. Commodities/Futures:
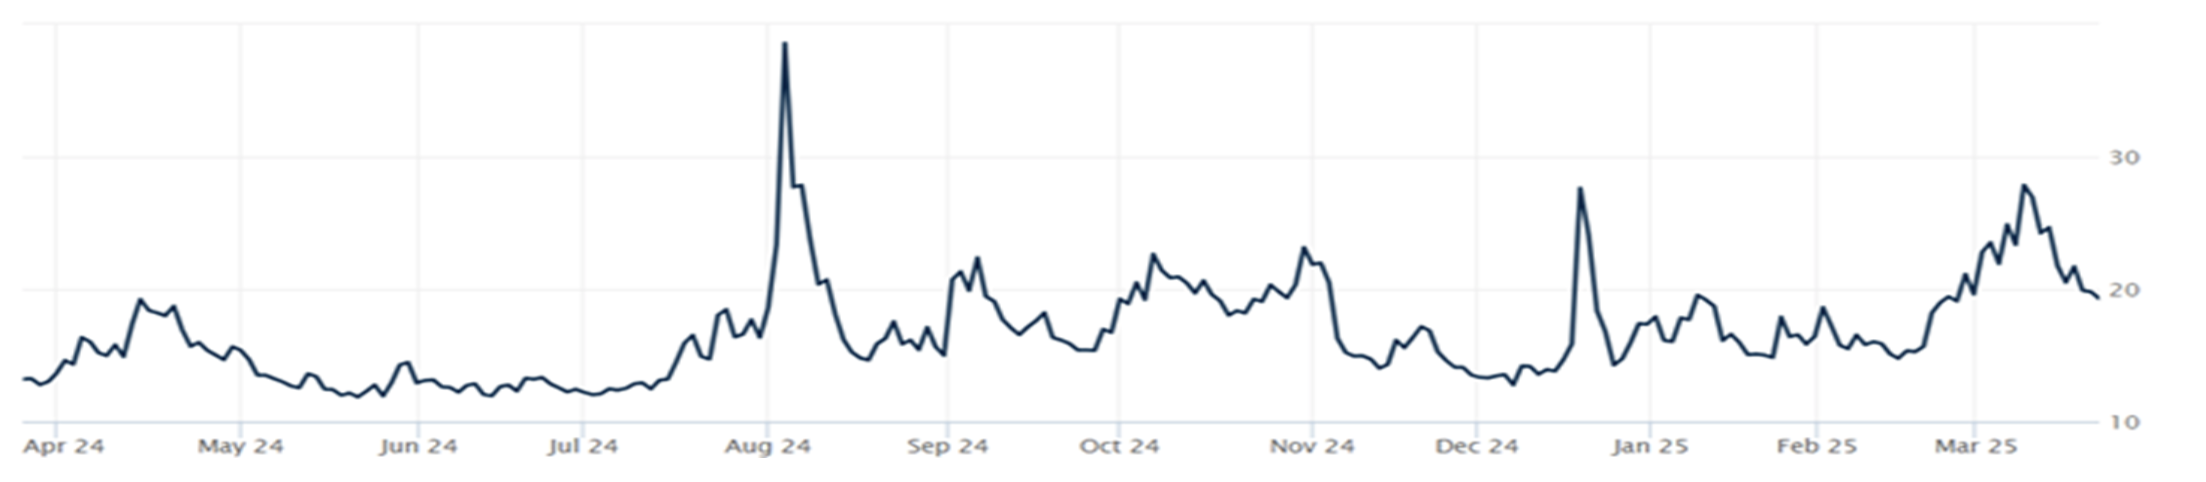
THE VOLATILITY INDEX (VIX) closed at 19.28 this week, an 11.4% decrease vs last week’s close of 21.77.
International Markets:
THIS WEEK’S ECONOMIC NEWS
U.S. Economic News:
No Change in Fed Rates: The Federal Reserve kept interest rates steady at 4.25%–4.5% following its March policy meeting, as expected, while maintaining its forecast for 50 basis points of rate cuts in 2024. However, officials raised their inflation expectations for 2025 and lowered GDP growth projections, citing increased economic uncertainty. Despite this, Fed Chair Jerome Powell struck a reassuring tone, suggesting that tariff impacts would be temporary and that long-term inflation expectations remained anchored around the 2% target, which markets viewed positively. Meanwhile, economic data painted a mixed picture—retail sales for February rose just 0.2%, well below estimates, and January’s decline was revised lower, while the Empire State Manufacturing Survey signaled deteriorating business conditions. In contrast, housing market data was more upbeat, with existing home sales jumping 4.2% in February due to rising supply, and housing starts exceeding expectations at an annualized rate of 1.5 million, despite a year-over-year decline.
International Economic News:
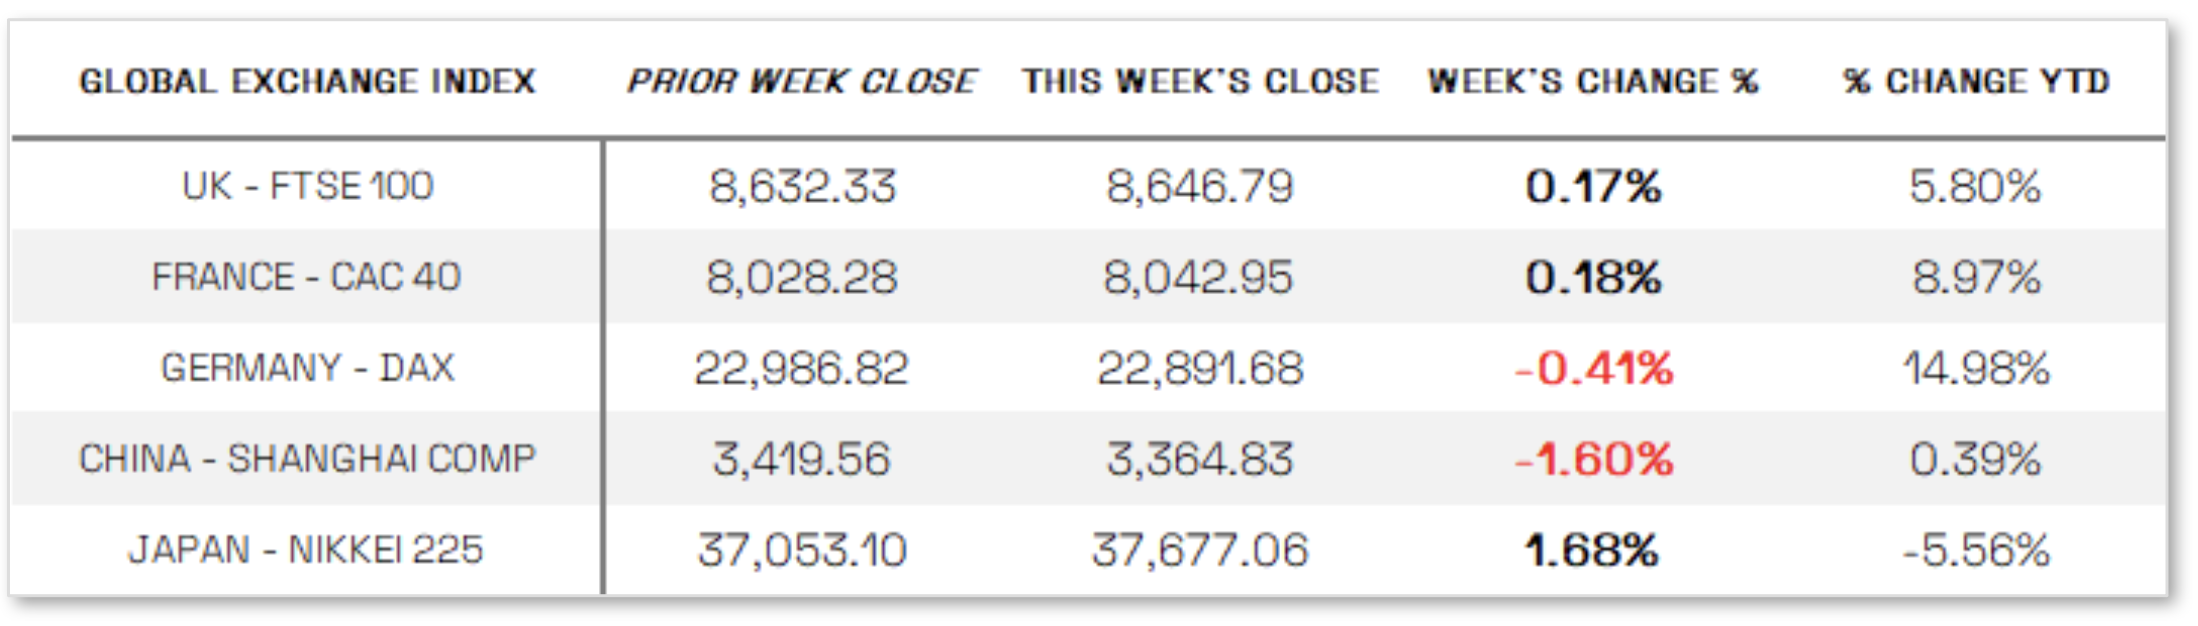
EUROPE: The pan-European STOXX Europe 600 Index gained 0.56% in local currency terms, breaking a two-week losing streak as optimism over potential government spending lifted markets, though concerns about impending U.S. tariffs kept gains in check. Major indexes were mixed, with Germany’s DAX slipping 0.41%, France’s CAC 40 edging higher, and Italy’s FTSE MIB rising 0.98%, while the UK’s FTSE 100 finished slightly up. Meanwhile, central banks grappled with balancing growth concerns and inflation risks. The Bank of England held rates at 4.5%, with only one policymaker voting for a cut, signaling a more hawkish stance than markets expected. Sweden’s Riksbank also left rates unchanged at 2.25%, with Governor Erik Thedéen suggesting stability through early 2028 but keeping options open for adjustments. In contrast, the Swiss National Bank cut rates by 0.25 percentage points to 0.25%, citing low inflation and rising economic risks, though SNB President Martin Schlegel downplayed the likelihood of further cuts.
JAPAN: Japan’s stock markets advanced over the week, with the Nikkei 225 climbing 1.68% and the broader TOPIX rising 3.25%, driven by foreign investor interest in Japanese trading companies. The Bank of Japan (BoJ) maintained a cautious stance, keeping rates unchanged while assessing the potential economic impact of higher U.S. tariffs. The yen weakened to the lower end of the JPY 149 range against the U.S. dollar from JPY 148.6 the previous week, while the 10-year Japanese government bond yield dipped slightly to 1.52% from 1.54%. At its March 18–19 meeting, the BoJ held its short-term policy rate steady at 0.5%, reaffirming its stance that future tightening would depend on price outlook developments. Governor Kazuo Ueda acknowledged trade policy risks, while investors continued to anticipate a gradual rate hike trajectory. Economic data suggested room for further increases, with Japan’s core consumer price index rising 3.0% year over year in February—above expectations but slowing from January’s 3.2%—and wage negotiations indicating steady growth. The BoJ remains focused on reinforcing a virtuous cycle between wages and prices, citing sustained high rice prices and the fading impact of government inflation-control measures as key factors likely to drive inflation through fiscal 2025.
CHINA: Mainland Chinese stock markets declined as investors turned cautious after two weeks of gains, with the CSI 300 Index dropping 2.29% and the Shanghai Composite Index falling 1.60% in local currency terms, while Hong Kong’s Hang Seng Index lost 1.13%. Despite the market pullback, economic data showed a strong start to the year, with retail sales rising 4.0% year over year in January-February—the fastest pace since November—while industrial output grew 5.9%, surpassing expectations but slowing from December’s 6.2% expansion. Fixed asset investment, including property and infrastructure, increased 4.1%, exceeding forecasts and December’s 3.2% growth. However, weakness in the property sector persisted, with real estate investment sinking 9.8% in the first two months of 2025, following a 10.6% drop in December, and urban unemployment rising to a two-year high of 5.4%. In response to the data, several brokerages raised their GDP forecasts, expressing confidence in China’s ability to meet its annual growth target of around 5%, as outlined at the National People’s Congress, where officials pledged stronger fiscal and monetary support and prioritized boosting consumption amid escalating U.S. trade tensions.
Sources:
All index and returns data from Norgate Data and Commodity Systems Incorporated and Wall Street Journal.
>> News from Reuters, Barron’s, Wall St. Journal, Bloomberg.com, ft.com, guggenheimpartners.com, zerohedge.com, ritholtz.com, markit.com, financialpost.com, Eurostat, Statistics Canada, Yahoo! Finance, stocksandnews.com, marketwatch.com, visualcapitalist.com, wantchinatimes.com, BBC, 361capital.com, pensionpartners.com, cnbc.com, FactSet, Morningstar/Ibbotson Associates, Corporate Finance Institute.
>> Commentary from T Rowe Price Global markets weekly update — https://www.troweprice.com/personal-investing/resources/insights/global-markets-weekly-update.html
Disclosures: This material and any mention of specific investments is provided for informational purposes only and is not intended to be investment advice or a recommendation to take any action. The forecasts or forward-looking statements are based on assumptions, may not materialize, and are subject to revision without notice. The market indexes discussed are unmanaged, and generally, considered representative of their respective markets. Index performance is not indicative of the past performance of a particular investment. Indexes do not incur management fees, costs, and expenses. Individuals cannot directly invest in unmanaged indexes. Past performance does not guarantee future results.
