


THE COMPLETE PICTURE
>> Four indicators across three time frames.
>> When the Sherman Portfolios indicators are not all the same status, we read the market as being in a Mixed Market.
1. DELTA-V — Positive since April 21, 2023
2. GALACTIC SHIELD — Positive since April 1, 2023
3. STARFLUX— Negative since March 10, 2025
4. STARPATH — Negative since March 7, 2025
The shorter term picture:
>> GALACTIC SHIELD — POSITIVE, for Q1 2025, indicating positive prospects for equities in the first quarter of 2025. This indicator is based on the combination of U.S. and International Equities trend statuses at the start of each quarter.
>> STARFLUX— NEGATIVE, Starflux ended the week at -7.61 (down 8.49 last week) This short-term indicator measures U.S. Equities.
>> STARPATH — NEGATIVE, This indicator measures the interplay on dual timeframes of our Type 1s + the Russell 3000 + our four most ‘pro-cyclical’ Type 3s, vs. Cash.
The big picture:
The ‘big picture’ is the (typically) years-long timeframe, the same timeframe in which Cyclical Bulls and Bears operate.
>> The Sherman Portfolios DELTA-V Indicator measuring the Bull/Bear cycle finished the week in BULL status at 50.10, down 6.62% from the prior week’s 53.65. It has signaled Bull since April 21, 2023.
>> The Sherman Portfolios DELTA-V Bond Indicator measuring the Bull/Bear cycle finished the week in BULL status at 61.08, down 0.39% from the prior week’s 61.32. It has signaled Bull since December 15, 2023.
THIS WEEK IN THE MARKETS
U.S. Markets:
Markets continue downward trend:
U.S. stocks ended the week with losses, marking a fourth consecutive decline for the S&P 500, Nasdaq Composite, and Russell 2000, while the S&P MidCap 400 fell for the seventh straight week, and the Dow Jones Industrial Average dropped 3.16%, leaving all five indexes in negative territory for the year. Market sentiment was largely impacted by ongoing trade policy uncertainty, as the Trump administration continued to announce new tariffs. Additionally, concerns over economic growth and rising recession fears, exacerbated by President Trump’s comments about a “period of transition” for the U.S. economy, further weighed on investor confidence.
Looking at the US Indexes:
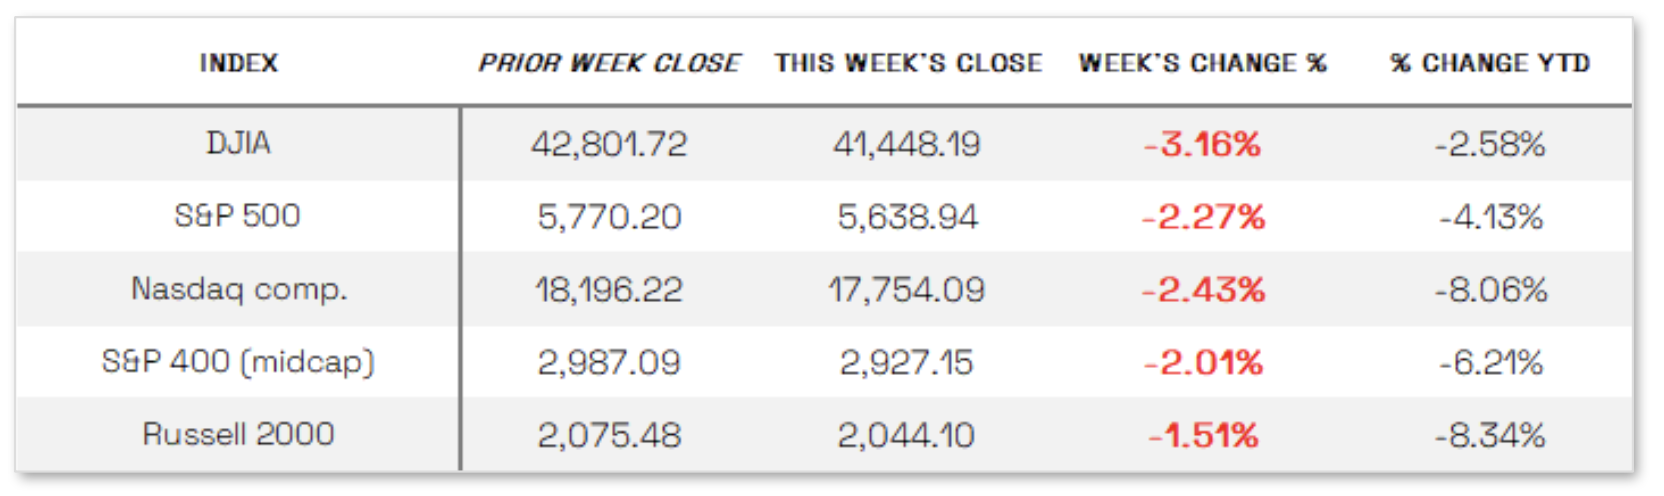
> The Dow Jones Industrial Average (DJIA) is the oldest continuing U.S. market index with over 100 years of history and is made up of 30 highly reputable “blue-chip” U.S. stocks (e.g. Coca-Cola Co., Microsoft). The Dow ended the week down 3.16% at 41,448.19 vs the prior week of 42,801.72.
> The Nasdaq Composite Index tracks most of the stocks listed on the Nasdaq Stock Market – the second-largest stock exchange in the world. Over half of all stocks on the NASDAQ are tech stocks. The tech-driven Nasdaq ended the week down 2.43%, closing at 17,754.09 vs. the prior week of 18,196.22.
> The S&P 500 large-cap index is a market-capitalization-weighted index of 500 leading publicly traded companies in the U.S. The S&P 500 is regarded as one of the best gauges of prominent American equities’ performance, and by extension, that of the stock market overall. The S&P 500 ended the week down 2.27%, closing at 5,638.94 compared to last week’s 5,770.20.
> The S&P 400 mid-cap index is the benchmark index made up of 400 stocks that broadly represent companies with midrange market capitalization between $3.6 billion and $13.1 billion. It is used by investors as a gauge for market performance and directional trends in U.S. stocks. The S&P 400 mid-cap ended the week down 2.01%, closing at 2,927.15 compared to last week’s 2,987.09.
> The Russell 2000 (RUT) small-cap index measures the performance of the 2,000 smaller companies included in the Russell 3000 Index. The Russell 2000 is managed by London’s FTSE Russell Group and is widely regarded as a leading indicator of the U.S. economy because of its focus on smaller companies that focus on the U.S. market. The Russell 2000 ended the week down 1.51%, closing at 2,044.10 compared to last week’s 2,075.48.
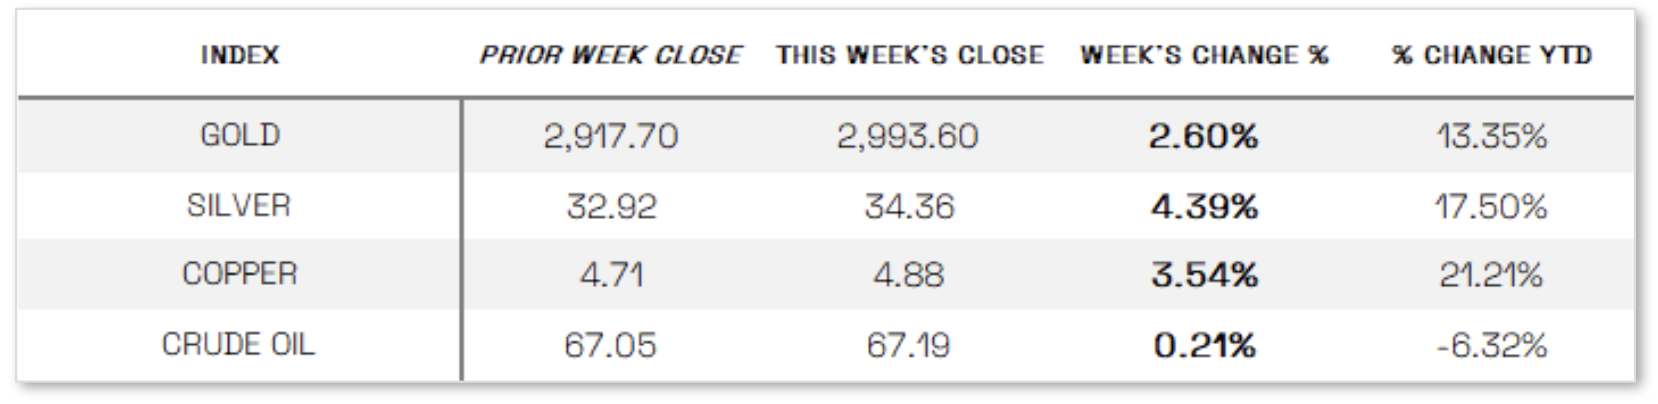
U.S. Commodities/Futures:
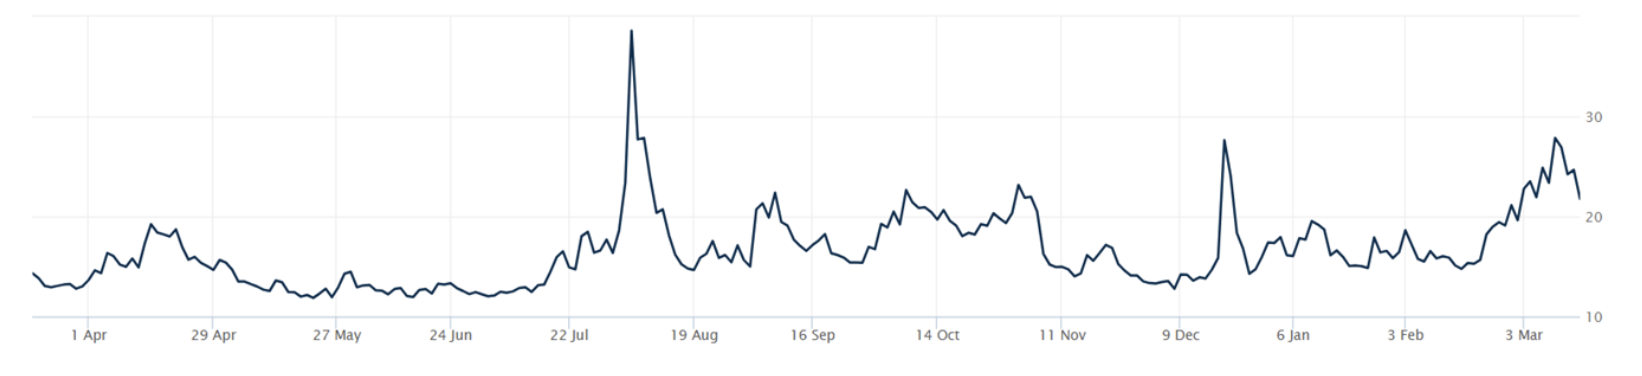
THE VOLATILITY INDEX (VIX) closed at 21.77 this week, a 6.8% decrease vs last week’s close of 23.37.
International Markets:
THIS WEEK’S ECONOMIC NEWS
U.S. Economic News:
Mixed economic sentiment: February saw a slowdown in price growth, as highlighted by the Labor Department’s consumer price index (CPI) report, which showed a 0.2% month-over-month rise and a 3.1% year-over-year increase in core CPI—the lowest since April 2021—both slightly below expectations. This inflation deceleration eased some concerns about stagflation, but investors remained focused on the potential impact of recent tariff actions. Similarly, the producer price index (PPI) revealed flat headline prices and a decline in core prices for the first time since July, though components tied to the Fed’s preferred inflation measure, the PCE index, remained elevated. With the Fed expected to hold interest rates steady after its March 18–19 meeting, consumer sentiment continued to deteriorate, as the University of Michigan’s Index of Consumer Sentiment fell 11% in March, marking a third consecutive monthly decline. The report cited broad economic uncertainty, with year-ahead inflation expectations jumping to 4.9%, the highest since November 2022, fueling further concerns about the economic outlook.
International Economic News:
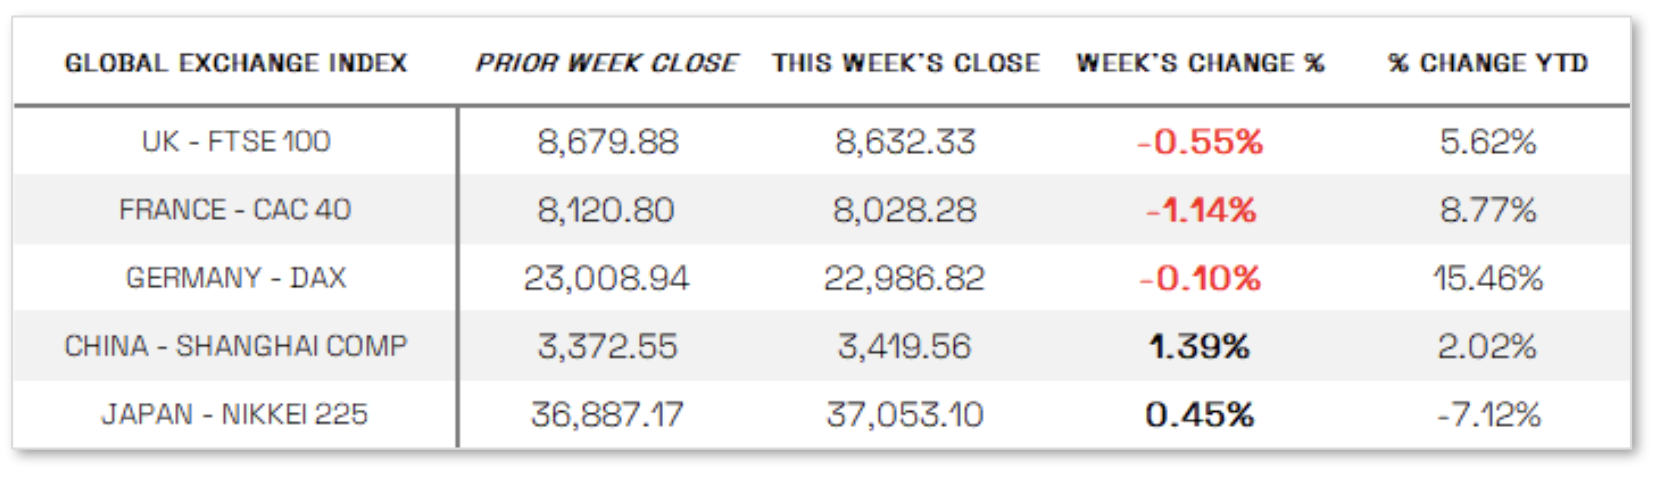
EUROPE: The pan-European STOXX Europe 600 Index fell 1.23% amid concerns over U.S. trade tariffs’ impact on economic growth and uncertainty surrounding monetary policy, though hopes for a Ukraine-Russia ceasefire and Germany’s approval of increased state borrowing helped limit losses. Major indexes were mostly lower, with France’s CAC 40 dropping 1.14%, the UK’s FTSE 100 down 0.55%, and Germany’s DAX down 0.10%. Meanwhile, doubts emerged about an April rate cut from the European Central Bank (ECB) despite its recent decision to lower rates for the sixth time since June. ECB President Christine Lagarde warned of “exceptionally high uncertainty,” while Executive Board member Isabel Schnabel suggested inflation was more likely to remain above the 2% target than below. Governing Council member Martins Kazaks also emphasized geopolitical risks and potential defense spending increases as reasons to remain cautious, whereas Bank of Portugal Governor Mário Centeno argued for lower borrowing costs to support economic growth, stating, “I would prefer to move sooner rather than later.”
JAPAN: Japan’s stock markets posted modest gains, with the Nikkei 225 rising 0.45% and the TOPIX up 0.27%, supported by a weaker yen, which fell to around JPY 148.7 per U.S. dollar, benefiting exporters. However, concerns over global trade, particularly the Trump administration’s proposed 25% tariffs on imported cars—a major component of Japan’s exports to the U.S.—tempered sentiment. Investors also focused on Japan’s spring “shunto” wage negotiations, which secured the largest pay increases in over three decades, reinforcing expectations of steady wage growth, even among smaller firms. This trend could influence the Bank of Japan’s (BoJ) decision on future rate hikes as it seeks a virtuous cycle of rising wages and inflation. Market expectations for another BoJ rate increase later this year remained strong, as reflected in the 10-year Japanese government bond (JGB) yield hovering near its highest level since the 2008 financial crisis. BoJ Governor Kazuo Ueda acknowledged the rising JGB yields as a natural market reaction but indicated that the central bank would only intervene if yields spiked abnormally, signaling a higher threshold for bond market intervention.
CHINA: Mainland Chinese stocks rose on stimulus hopes after Beijing announced a press conference for Monday featuring policymakers focused on boosting consumption, lifting the CSI 300 Index by 1.59% and the Shanghai Composite by 1.39%, while Hong Kong’s Hang Seng Index fell 1.06%. Officials from China’s finance and commerce ministries, central bank, and financial watchdog are expected to outline plans to drive consumption, a key priority as China aims for 5% economic growth in 2025 amid ongoing trade tensions with the U.S. The announcement spurred a rally, pushing the CSI 300 to its highest level since mid-December. However, weak domestic demand was evident in February’s inflation data, with the consumer price index falling 0.7% year over year—its first contraction since January 2024—while core CPI declined 0.1%, marking only the second contraction in over 15 years. Additionally, the producer price index dropped for the 29th consecutive month, down 2.2%, highlighting persistent deflationary pressures.
Sources:
>> All index and returns data from Norgate Data and Commodity Systems Incorporated and Wall Street Journal.
>> News from Reuters, Barron’s, Wall St. Journal, Bloomberg.com, ft.com, guggenheimpartners.com, zerohedge.com, ritholtz.com, markit.com, financialpost.com, Eurostat, Statistics Canada, Yahoo! Finance, stocksandnews.com, marketwatch.com, visualcapitalist.com, wantchinatimes.com, BBC, 361capital.com, pensionpartners.com, cnbc.com, FactSet, Morningstar/Ibbotson Associates, Corporate Finance Institute.
>> Commentary from T Rowe Price Global markets weekly update — https://www.troweprice.com/personal-investing/resources/insights/global-markets-weekly-update.html
Disclosures: This material and any mention of specific investments is provided for informational purposes only and is not intended to be investment advice or a recommendation to take any action. The forecasts or forward-looking statements are based on assumptions, may not materialize, and are subject to revision without notice. The market indexes discussed are unmanaged, and generally, considered representative of their respective markets. Index performance is not indicative of the past performance of a particular investment. Indexes do not incur management fees, costs, and expenses. Individuals cannot directly invest in unmanaged indexes. Past performance does not guarantee future results.
