


THE COMPLETE PICTURE (four indicators across three time frames): When all four of the Sherman Portfolios indicators are in a POSITIVE status, we read the market as being in a BULL MARKET.
1. DELTA-V — Positive
2. GALACTIC SHIELD — Positive
3. STARFLUX— Positive
4. STARPATH — Positive
The very big picture (a historical perspective): The CAPE is now at 38.54.
The long-term valuation of the market is commonly measured by the Cyclically Adjusted Price to Earnings ratio, or “CAPE”, which smooths-out shorter-term earnings swings in order to get a longer-term assessment of market valuation. In the past, the CAPE ratio has proved its importance in identifying potential bubbles and market crashes. An extremely high CAPE ratio means that a company’s stock price is substantially higher than the company’s earnings would indicate and, therefore, overvalued. It is generally expected that the market will eventually correct the company’s stock price by pushing it down to its true value. The historical average of the ratio for the S&P 500 Index is between 15-16, while the highest levels of the ratio have exceeded 30.
The record-high levels occurred three times in the history of the U.S. financial markets. The first was in 1929 before the Wall Street crash that signaled the start of the Great Depression. The second was in the late 1990s before the Dotcom Crash, and the third came in 2007 before the 2007-2008 Financial Crisis. https://www.multpl.com/shiller-pe
HISTORY OF THE CAPE VALUE FROM 1871 TO PRESENT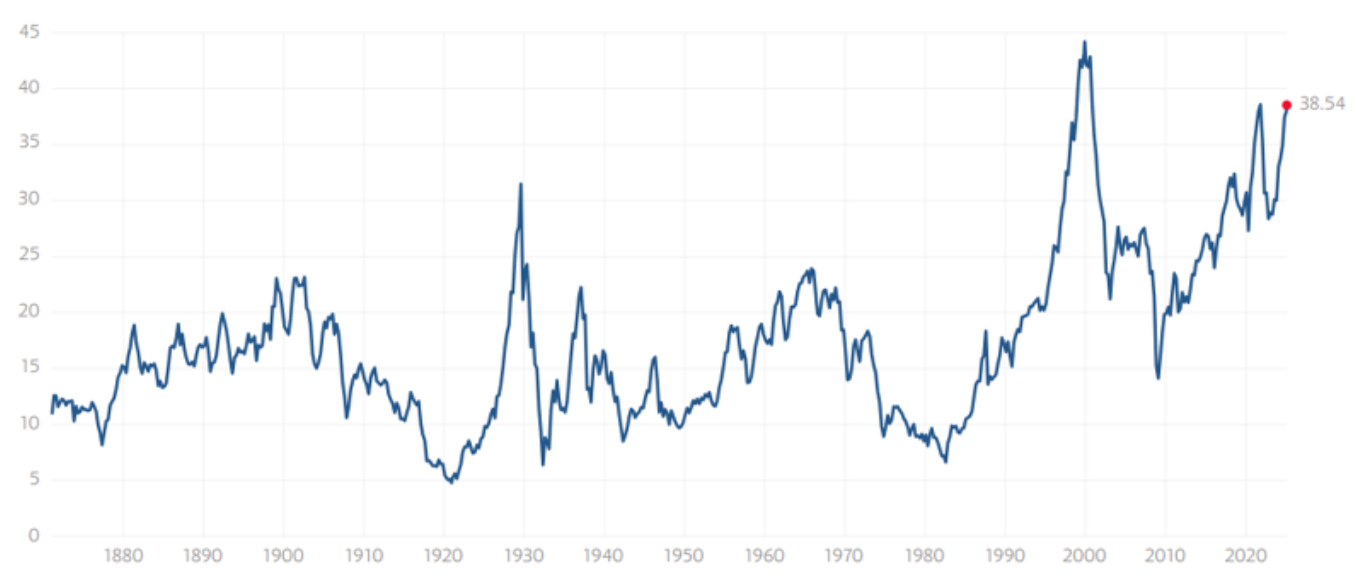
Note: We do not use CAPE as an official input into our methods. However, we think history serves as a guide and that it’s good to know where we are on the historic continuum. https://www.multpl.com/shiller-pe
The big picture: The ‘big picture’ is the (typically) years-long timeframe, the same timeframe in which Cyclical Bulls and Bears operate. The Sherman Portfolios DELTA-V Indicator measuring the Bull/Bear cycle finished the week in BULL status at 62.35, up 1.98% from the prior week’s 61.14. It has signaled Bull since April 21, 2023. The Sherman Portfolios DELTA-V Bond Indicator measuring the Bull/Bear cycle finished the week in BULL status at 54.17, up 1.12% from the prior week’s 53.57. It has signaled Bull since December 15, 2023.
The shorter term picture: GALACTIC SHIELD — POSITIVE for Q1 2025. indicating positive prospects for equities in the first quarter of 2025. This indicator is based on the combination of U.S. and International Equities trend statuses at the start of each quarter. STARFLUX— POSITIVE, Starflux ended the week at 7.38 (up 24.24% last week). This short-term indicator measures U.S. Equities. STARPATH — POSITIVE, This indicator measures the interplay on dual timeframes of our Type 1s + the Russell 3000 + our four most ‘pro-cyclical’ Type 3s, vs. Cash.
THIS WEEK IN THE MARKETS
U.S. Markets:
Stocks up this week:
U.S. stocks ended mostly higher, with the Nasdaq Composite leading gains at 2.58% for the week, while growth stocks outperformed value shares for the second time this year, as measured by Russell indexes. Small-cap stocks underperformed, with the Russell 2000 Index trailing the S&P 500 by 146 basis points. Both the S&P 500 and Nasdaq Composite closed within 1% of record highs. The market saw its strongest gains on Thursday after President Donald Trump opted against introducing new global tariffs, instead signing an order for a study that could lead to reciprocal tariffs on a country-by-country basis by April 1. While some uncertainty remained, investors responded positively, viewing the delay as an opportunity for further negotiations with trade partners.
Looking at the US Indexes:
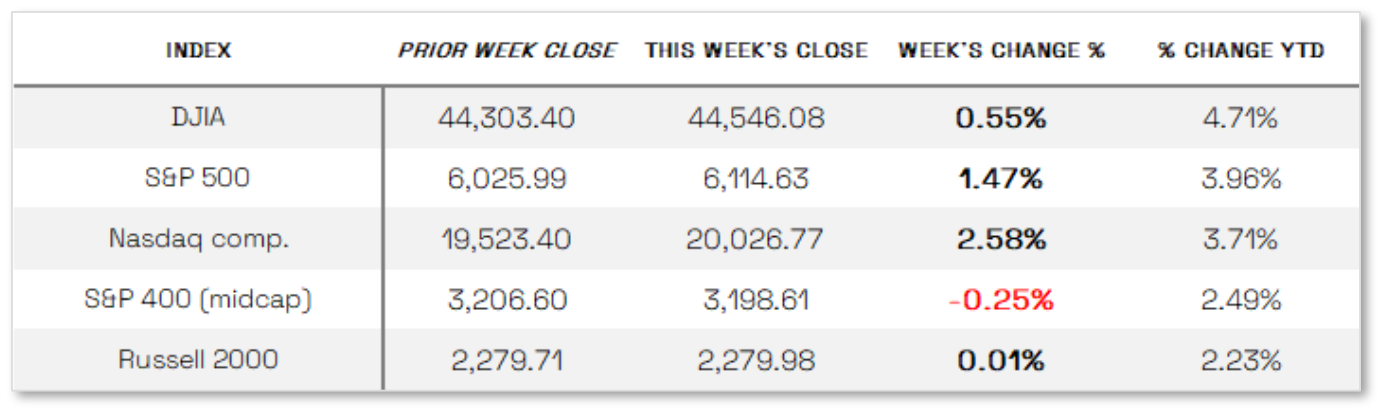
The Dow Jones Industrial Average (DJIA) is the oldest continuing U.S. market index with over 100 years of history and is made up of 30 highly reputable “blue-chip” U.S. stocks (e.g. Coca-Cola Co., Microsoft). The Dow ended the week up 0.55% at 44,546.08 vs the prior week of 44,303.40.
The Nasdaq Composite Index tracks most of the stocks listed on the Nasdaq Stock Market – the second-largest stock exchange in the world. Over half of all stocks on the NASDAQ are tech stocks. The tech-driven Nasdaq ended the week up 2.58%, closing at 20,026.77 vs. the prior week of 19,523.40.
The S&P 500 large-cap index is a market-capitalization-weighted index of 500 leading publicly traded companies in the U.S. The S&P 500 is regarded as one of the best gauges of prominent American equities’ performance, and by extension, that of the stock market overall. The S&P 500 ended the week up 1.47%, closing at 6114.63 compared to last week’s 6025.99.
The S&P 400 mid-cap index is the benchmark index made up of 400 stocks that broadly represent companies with midrange market capitalization between $3.6 billion and $13.1 billion. It is used by investors as a gauge for market performance and directional trends in U.S. stocks. The S&P 400 mid-cap ended the week down 0.25%, closing at 3198.61 compared to last week’s 3206.60.
The Russell 2000 (RUT) small-cap index measures the performance of the 2,000 smaller companies included in the Russell 3000 Index. The Russell 2000 is managed by London’s FTSE Russell Group and is widely regarded as a leading indicator of the U.S. economy because of its focus on smaller companies that focus on the U.S. market. The Russell 2000 ended the week up 0.01%, closing at 2279.98 compared to last week’s 2279.71.
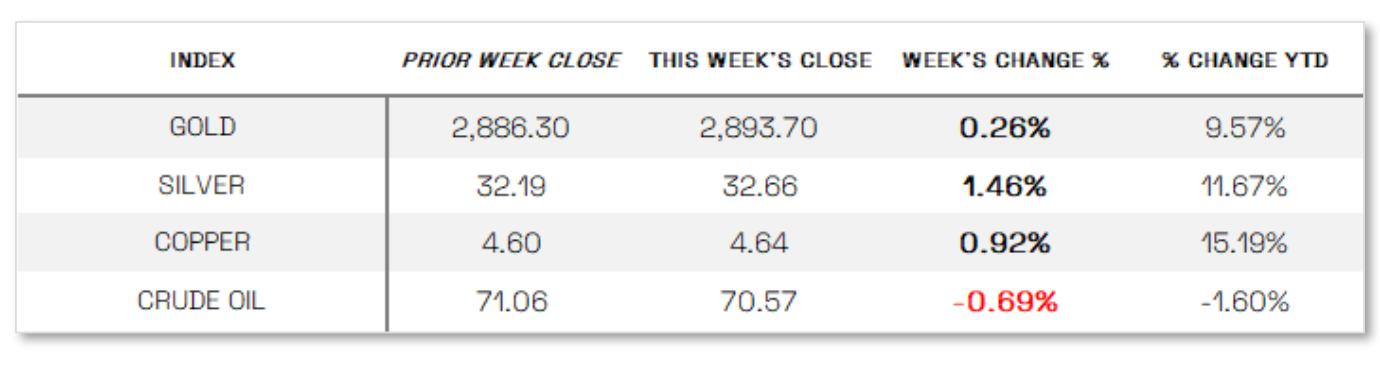
U.S. Commodities/Futures:
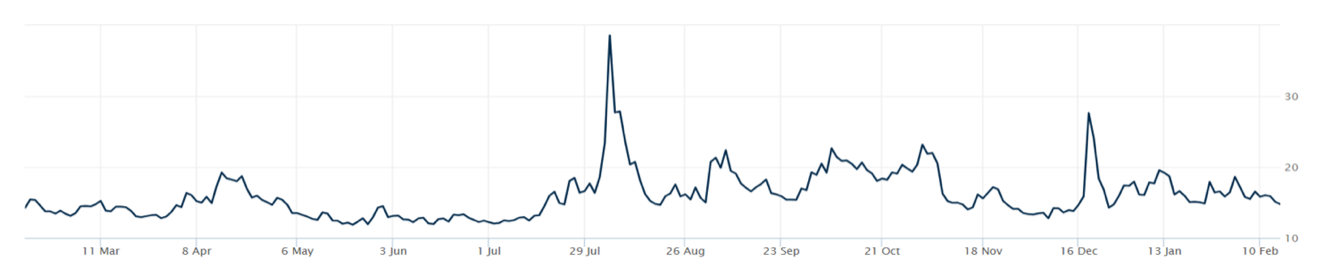
THE VOLATILITY INDEX (VIX) closed at 14.77 this week, a 10.5% decrease vs last week’s close of 16.51.
International Markets:
THIS WEEK’S ECONOMIC NEWS
U.S. Economic News:
CPI continues to increase: Stronger-than-expected inflation data in January reinforced expectations that the Federal Reserve will keep interest rates higher for longer. The Bureau of Labor Statistics reported that the consumer price index (CPI) rose 0.5% month over month and 3.0% year over year, up from December’s 0.4% and 2.9%, respectively, with shelter costs accounting for nearly 30% of the monthly increase. Core CPI, which excludes food and energy, also accelerated to 0.4% from 0.2% in December. The producer price index (PPI) similarly exceeded expectations, rising 0.4% versus the anticipated 0.3%, though cooling in certain components, such as health care and airfares, helped temper concerns. Federal Reserve Chair Jerome Powell acknowledged the progress in reducing inflation but emphasized the need to maintain restrictive policy, a sentiment echoed by Chicago Fed President Austan Goolsbee, who warned that sustained inflationary pressures would indicate that the job is not yet done. In response, futures markets pushed expectations for the first rate cut from September to December.
International Economic News:
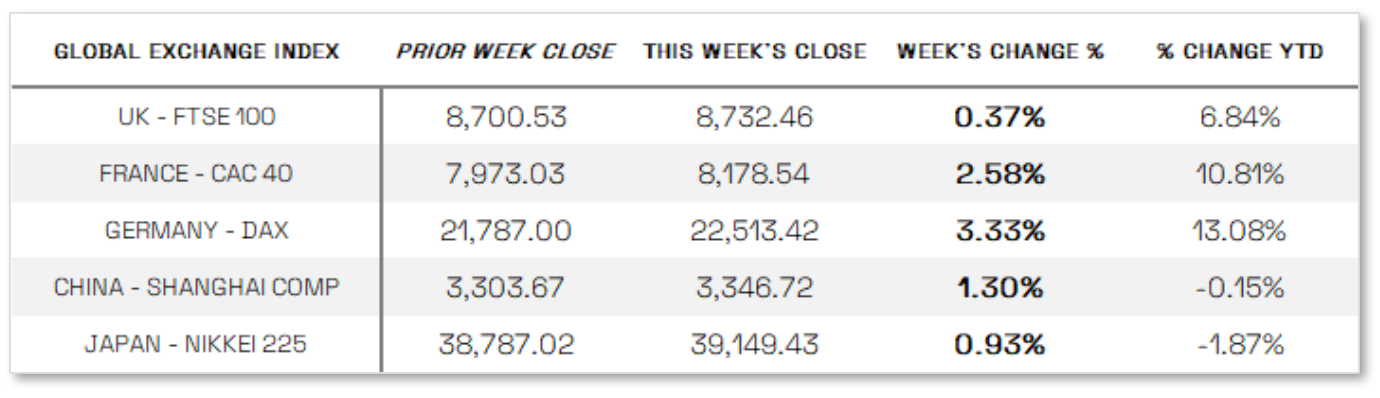
EUROPE: The pan-European STOXX Europe 600 Index climbed 1.78% to a fresh record high, supported by optimism over a potential resolution to the Ukraine-Russia conflict and strong earnings reports. Major European stock indexes also advanced, with Germany’s DAX rising 3.33%, France’s CAC 40 gaining 2.58%, Italy’s FTSE MIB adding 2.49%, and the UK’s FTSE 100 edging up 0.37%. Meanwhile, the UK economy unexpectedly grew by 0.1% in the final quarter of 2023, defying expectations of a contraction, as a 0.4% expansion in December offset weakness in production. Annual GDP growth accelerated to 0.9% in 2024 from 0.3% in the previous year. Despite this resilience, Bank of England Chief Economist Huw Pill urged caution on rate cuts, citing persistent wage pressures and the need for gradual policy adjustments. However, MPC member Catherine Mann argued that the BoE should have cut rates more aggressively, as a weakening labor market and slowing consumer demand were already helping to curb inflation.
JAPAN: stock markets advanced over the week, with the Nikkei 225 rising 0.93% and the TOPIX gaining 0.80%, supported by a weaker yen and optimism following U.S. President Donald Trump’s decision to delay immediate reciprocal tariffs on trading partners. Japanese authorities stated they would assess the details and potential impact of any future U.S. tariffs before responding. Meanwhile, uncertainty remained over the pace of interest rate hikes by the Bank of Japan (BoJ), as Japanese government bond yields climbed amid growing speculation that rate increases could come sooner than expected. The 10-year JGB yield rose to 1.35% from 1.28%, marking its highest level in nearly 15 years.
CHINA: Mainland Chinese stock markets gained as hopes grew that U.S. tariffs on Chinese imports might be less severe than expected after the Trump administration imposed a 10% tariff in early February. The CSI 300 Index rose 1.19%, while the Shanghai Composite Index climbed 1.30% in local currency terms, according to FactSet. Hong Kong’s Hang Seng Index surged 7.04%, driven by strong investor demand for artificial intelligence stocks. On the economic front, China’s consumer price index increased by a higher-than-expected 0.5% in January from a year earlier, marking the first inflation acceleration since August, likely fueled by pre-Lunar New Year spending. However, factory deflation persisted, with the producer price index declining 2.3% for the 28th consecutive month, highlighting Beijing’s ongoing struggle to revive demand despite monetary and fiscal stimulus introduced last September. A prolonged housing downturn has encouraged saving over spending, complicating efforts to boost domestic consumption.
Sources:
>> All index and returns data from Norgate Data and Commodity Systems Incorporated and Wall Street Journal.
>> News from Reuters, Barron’s, Wall St. Journal, Bloomberg.com, ft.com, guggenheimpartners.com, zerohedge.com, ritholtz.com, markit.com, financialpost.com, Eurostat, Statistics Canada, Yahoo! Finance, stocksandnews.com, marketwatch.com, visualcapitalist.com, wantchinatimes.com, BBC, 361capital.com, pensionpartners.com, cnbc.com, FactSet, Morningstar/Ibbotson Associates, Corporate Finance Institute.
>> Commentary from T Rowe Price Global markets weekly update — https://www.troweprice.com/personal-investing/resources/insights/global-markets-weekly-update.html
Disclosures: This material is provided for informational purposes only and is not intended to be investment advice or a recommendation to take any action. Past performance cannot guarantee future results.
THE COMPLETE PICTURE (four indicators across three time frames): When all four of the Sherman Portfolios indicators are in a POSITIVE status, we read the market as being in a BULL MARKET.
1. DELTA-V — Positive
2. GALACTIC SHIELD — Positive
3. STARFLUX— Positive
4. STARPATH — Positive
The very big picture (a historical perspective): The CAPE is now at 38.54.
The long-term valuation of the market is commonly measured by the Cyclically Adjusted Price to Earnings ratio, or “CAPE”, which smooths-out shorter-term earnings swings in order to get a longer-term assessment of market valuation. In the past, the CAPE ratio has proved its importance in identifying potential bubbles and market crashes. An extremely high CAPE ratio means that a company’s stock price is substantially higher than the company’s earnings would indicate and, therefore, overvalued. It is generally expected that the market will eventually correct the company’s stock price by pushing it down to its true value. The historical average of the ratio for the S&P 500 Index is between 15-16, while the highest levels of the ratio have exceeded 30.
The record-high levels occurred three times in the history of the U.S. financial markets. The first was in 1929 before the Wall Street crash that signaled the start of the Great Depression. The second was in the late 1990s before the Dotcom Crash, and the third came in 2007 before the 2007-2008 Financial Crisis. https://www.multpl.com/shiller-pe
HISTORY OF THE CAPE VALUE FROM 1871 TO PRESENT
Note: We do not use CAPE as an official input into our methods. However, we think history serves as a guide and that it’s good to know where we are on the historic continuum. https://www.multpl.com/shiller-pe
The big picture: The ‘big picture’ is the (typically) years-long timeframe, the same timeframe in which Cyclical Bulls and Bears operate. The Sherman Portfolios DELTA-V Indicator measuring the Bull/Bear cycle finished the week in BULL status at 62.35, up 1.98% from the prior week’s 61.14. It has signaled Bull since April 21, 2023. The Sherman Portfolios DELTA-V Bond Indicator measuring the Bull/Bear cycle finished the week in BULL status at 54.17, up 1.12% from the prior week’s 53.57. It has signaled Bull since December 15, 2023.
The shorter term picture: GALACTIC SHIELD — POSITIVE for Q1 2025. indicating positive prospects for equities in the first quarter of 2025. This indicator is based on the combination of U.S. and International Equities trend statuses at the start of each quarter. STARFLUX— POSITIVE, Starflux ended the week at 7.38 (up 24.24% last week). This short-term indicator measures U.S. Equities. STARPATH — POSITIVE, This indicator measures the interplay on dual timeframes of our Type 1s + the Russell 3000 + our four most ‘pro-cyclical’ Type 3s, vs. Cash.
THIS WEEK IN THE MARKETS
U.S. Markets:
Stocks up this week:
U.S. stocks ended mostly higher, with the Nasdaq Composite leading gains at 2.58% for the week, while growth stocks outperformed value shares for the second time this year, as measured by Russell indexes. Small-cap stocks underperformed, with the Russell 2000 Index trailing the S&P 500 by 146 basis points. Both the S&P 500 and Nasdaq Composite closed within 1% of record highs. The market saw its strongest gains on Thursday after President Donald Trump opted against introducing new global tariffs, instead signing an order for a study that could lead to reciprocal tariffs on a country-by-country basis by April 1. While some uncertainty remained, investors responded positively, viewing the delay as an opportunity for further negotiations with trade partners.
Looking at the US Indexes:
The Dow Jones Industrial Average (DJIA) is the oldest continuing U.S. market index with over 100 years of history and is made up of 30 highly reputable “blue-chip” U.S. stocks (e.g. Coca-Cola Co., Microsoft). The Dow ended the week up 0.55% at 44,546.08 vs the prior week of 44,303.40.
The Nasdaq Composite Index tracks most of the stocks listed on the Nasdaq Stock Market – the second-largest stock exchange in the world. Over half of all stocks on the NASDAQ are tech stocks. The tech-driven Nasdaq ended the week up 2.58%, closing at 20,026.77 vs. the prior week of 19,523.40.
The S&P 500 large-cap index is a market-capitalization-weighted index of 500 leading publicly traded companies in the U.S. The S&P 500 is regarded as one of the best gauges of prominent American equities’ performance, and by extension, that of the stock market overall. The S&P 500 ended the week up 1.47%, closing at 6114.63 compared to last week’s 6025.99.
The S&P 400 mid-cap index is the benchmark index made up of 400 stocks that broadly represent companies with midrange market capitalization between $3.6 billion and $13.1 billion. It is used by investors as a gauge for market performance and directional trends in U.S. stocks. The S&P 400 mid-cap ended the week down 0.25%, closing at 3198.61 compared to last week’s 3206.60.
The Russell 2000 (RUT) small-cap index measures the performance of the 2,000 smaller companies included in the Russell 3000 Index. The Russell 2000 is managed by London’s FTSE Russell Group and is widely regarded as a leading indicator of the U.S. economy because of its focus on smaller companies that focus on the U.S. market. The Russell 2000 ended the week up 0.01%, closing at 2279.98 compared to last week’s 2279.71.
U.S. Commodities/Futures:
THE VOLATILITY INDEX (VIX) closed at 14.77 this week, a 10.5% decrease vs last week’s close of 16.51.
International Markets:
THIS WEEK’S ECONOMIC NEWS
U.S. Economic News:
CPI continues to increase: Stronger-than-expected inflation data in January reinforced expectations that the Federal Reserve will keep interest rates higher for longer. The Bureau of Labor Statistics reported that the consumer price index (CPI) rose 0.5% month over month and 3.0% year over year, up from December’s 0.4% and 2.9%, respectively, with shelter costs accounting for nearly 30% of the monthly increase. Core CPI, which excludes food and energy, also accelerated to 0.4% from 0.2% in December. The producer price index (PPI) similarly exceeded expectations, rising 0.4% versus the anticipated 0.3%, though cooling in certain components, such as health care and airfares, helped temper concerns. Federal Reserve Chair Jerome Powell acknowledged the progress in reducing inflation but emphasized the need to maintain restrictive policy, a sentiment echoed by Chicago Fed President Austan Goolsbee, who warned that sustained inflationary pressures would indicate that the job is not yet done. In response, futures markets pushed expectations for the first rate cut from September to December.
International Economic News:
EUROPE: The pan-European STOXX Europe 600 Index climbed 1.78% to a fresh record high, supported by optimism over a potential resolution to the Ukraine-Russia conflict and strong earnings reports. Major European stock indexes also advanced, with Germany’s DAX rising 3.33%, France’s CAC 40 gaining 2.58%, Italy’s FTSE MIB adding 2.49%, and the UK’s FTSE 100 edging up 0.37%. Meanwhile, the UK economy unexpectedly grew by 0.1% in the final quarter of 2023, defying expectations of a contraction, as a 0.4% expansion in December offset weakness in production. Annual GDP growth accelerated to 0.9% in 2024 from 0.3% in the previous year. Despite this resilience, Bank of England Chief Economist Huw Pill urged caution on rate cuts, citing persistent wage pressures and the need for gradual policy adjustments. However, MPC member Catherine Mann argued that the BoE should have cut rates more aggressively, as a weakening labor market and slowing consumer demand were already helping to curb inflation.
JAPAN: stock markets advanced over the week, with the Nikkei 225 rising 0.93% and the TOPIX gaining 0.80%, supported by a weaker yen and optimism following U.S. President Donald Trump’s decision to delay immediate reciprocal tariffs on trading partners. Japanese authorities stated they would assess the details and potential impact of any future U.S. tariffs before responding. Meanwhile, uncertainty remained over the pace of interest rate hikes by the Bank of Japan (BoJ), as Japanese government bond yields climbed amid growing speculation that rate increases could come sooner than expected. The 10-year JGB yield rose to 1.35% from 1.28%, marking its highest level in nearly 15 years.
CHINA: Mainland Chinese stock markets gained as hopes grew that U.S. tariffs on Chinese imports might be less severe than expected after the Trump administration imposed a 10% tariff in early February. The CSI 300 Index rose 1.19%, while the Shanghai Composite Index climbed 1.30% in local currency terms, according to FactSet. Hong Kong’s Hang Seng Index surged 7.04%, driven by strong investor demand for artificial intelligence stocks. On the economic front, China’s consumer price index increased by a higher-than-expected 0.5% in January from a year earlier, marking the first inflation acceleration since August, likely fueled by pre-Lunar New Year spending. However, factory deflation persisted, with the producer price index declining 2.3% for the 28th consecutive month, highlighting Beijing’s ongoing struggle to revive demand despite monetary and fiscal stimulus introduced last September. A prolonged housing downturn has encouraged saving over spending, complicating efforts to boost domestic consumption.
Sources:
>> All index and returns data from Norgate Data and Commodity Systems Incorporated and Wall Street Journal.
>> News from Reuters, Barron’s, Wall St. Journal, Bloomberg.com, ft.com, guggenheimpartners.com, zerohedge.com, ritholtz.com, markit.com, financialpost.com, Eurostat, Statistics Canada, Yahoo! Finance, stocksandnews.com, marketwatch.com, visualcapitalist.com, wantchinatimes.com, BBC, 361capital.com, pensionpartners.com, cnbc.com, FactSet, Morningstar/Ibbotson Associates, Corporate Finance Institute.
>> Commentary from T Rowe Price Global markets weekly update — https://www.troweprice.com/personal-investing/resources/insights/global-markets-weekly-update.html
Disclosures: This material and any mention of specific investments is provided for informational purposes only and is not intended to be investment advice or a recommendation to take any action. The forecasts or forward-looking statements are based on assumptions, may not materialize, and are subject to revision without notice. The market indexes discussed are unmanaged, and generally, considered representative of their respective markets. Index performance is not indicative of the past performance of a particular investment. Indexes do not incur management fees, costs, and expenses. Individuals cannot directly invest in unmanaged indexes. Past performance does not guarantee future results.
