


The very big picture (a historical perspective): The CAPE is now at 38.07.
The long-term valuation of the market is commonly measured by the Cyclically Adjusted Price to Earnings ratio, or “CAPE”, which smooths-out shorter-term earnings swings in order to get a longer-term assessment of market valuation. In the past, the CAPE ratio has proved its importance in identifying potential bubbles and market crashes. An extremely high CAPE ratio means that a company’s stock price is substantially higher than the company’s earnings would indicate and, therefore, overvalued. It is generally expected that the market will eventually correct the company’s stock price by pushing it down to its true value. The historical average of the ratio for the S&P 500 Index is between 15-16, while the highest levels of the ratio have exceeded 30.
The record-high levels occurred three times in the history of the U.S. financial markets. The first was in 1929 before the Wall Street crash that signaled the start of the Great Depression. The second was in the late 1990s before the Dotcom Crash, and the third came in 2007 before the 2007-2008 Financial Crisis. https://www.multpl.com/shiller-pe
HISTORY OF THE CAPE VALUE FROM 1871 TO PRESENT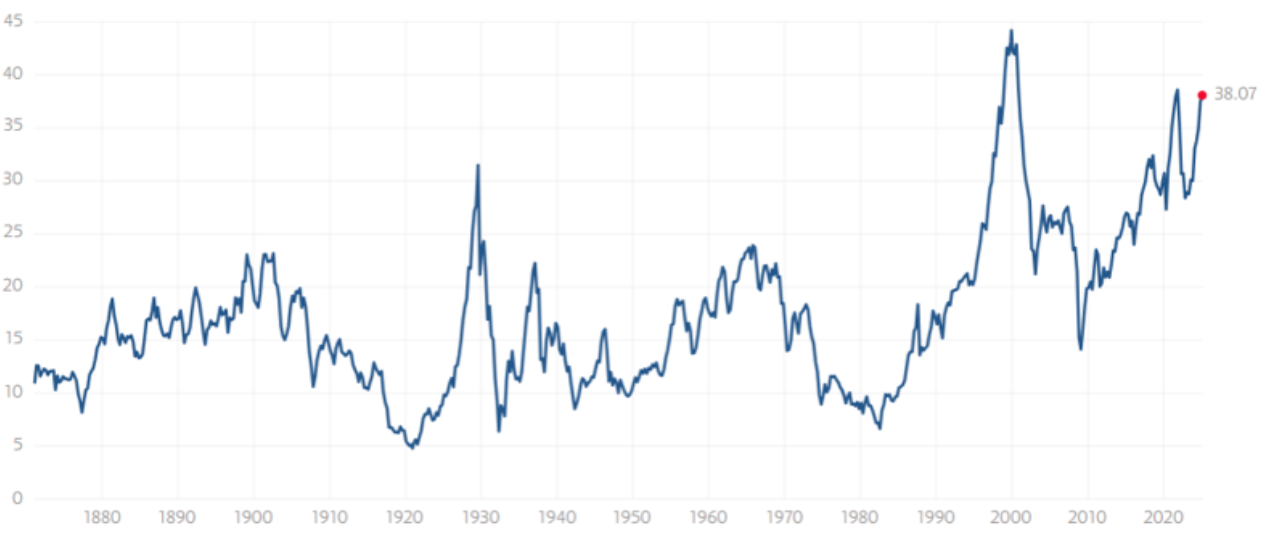
Note: We do not use CAPE as an official input into our methods. However, we think history serves as a guide and that it’s good to know where we are on the historic continuum. https://www.multpl.com/shiller-pe
The big picture: The ‘big picture’ is the (typically) years-long timeframe, the same timeframe in which Cyclical Bulls and Bears operate. The Sherman Portfolios DELTA-V Indicator measuring the Bull/Bear cycle finished the week in BULL status at 61.97, down 0.78% from the prior week’s 62.46. It has signaled Bull since April 21, 2023. The Sherman Portfolios DELTA-V Bond Indicator measuring the Bull/Bear cycle finished the week in BULL status at 51.05, up 5.54% from the prior week’s 48.37. It has signaled Bull since December 15, 2023.
The shorter term picture: GALACTIC SHIELD — POSITIVE for Q1 2025, indicating positive prospects for equities in the first quarter of 2025. This indicator is based on the combination of U.S. and International Equities trend statuses at the start of each quarter. STARFLUX— POSITIVE, Starflux ended the week at 6.14 (down 15.08% last week) This short-term indicator measures U.S. Equities. STARPATH — POSITIVE, This indicator measures the interplay on dual timeframes of our Type 1s + the Russell 3000 + our four most ‘pro-cyclical’ Type 3s, vs. Cash.
The complete picture (four indicators across three timeframes): When all four of the Sherman Portfolios indicators are in a POSITIVE status, we read the market as being in a BULL MARKET.
1. DELTA-V — Positive
2. GALACTIC SHIELD — Positive
3. STARFLUX— Positive
4. STARPATH — Positive
THIS WEEK IN THE MARKETS
U.S. Markets: Tech stocks down this week:
Stocks ended a volatile week mostly lower, with the Nasdaq Composite seeing a sharp drop on Monday as AI competition fears weighed on tech shares, particularly NVIDIA, which fell nearly 17% following the debut of DeepSeek’s energy-efficient large language model. Despite concerns, the Dow managed a modest gain, marking its third consecutive week of increases. Earnings season continued, with companies representing 40% of the S&P 500’s market cap reporting results; strong performances from Meta and Apple provided a late-week boost, helping indexes recover some losses. Meanwhile, political developments also shaped market sentiment as President Trump reaffirmed plans for 25% tariffs on Mexico and Canada by February 1, along with a potential 10% tariff on Chinese goods, dashing earlier investor hopes for a softer trade stance.
Looking at the US Indexes:
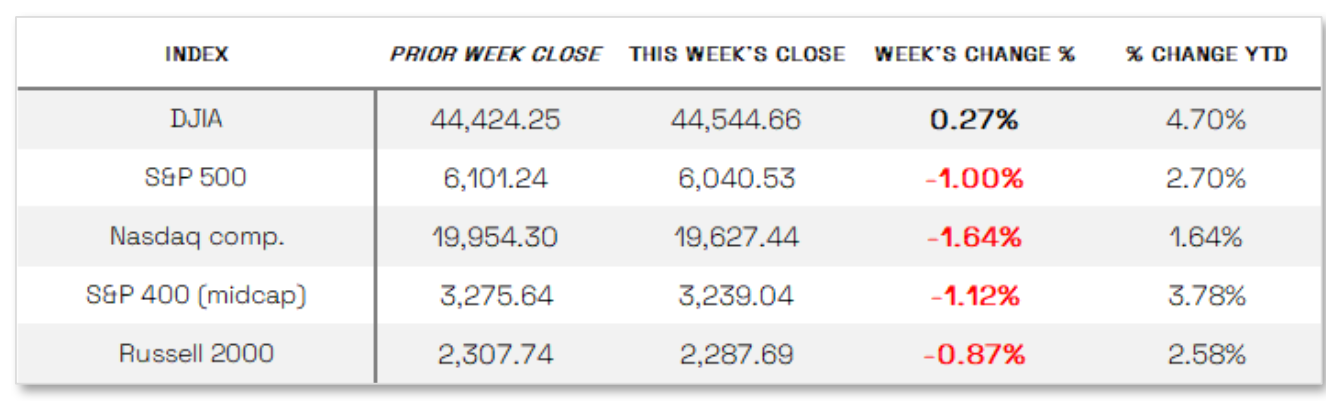
The Dow Jones Industrial Average (DJIA) is the oldest continuing U.S. market index with over 100 years of history and is made up of 30 highly reputable “blue-chip” U.S. stocks (e.g. Coca-Cola Co., Microsoft). The Dow ended the week up 0.27% at 44,544.66 vs the prior week of 44,424.25.
The Nasdaq Composite Index tracks most of the stocks listed on the Nasdaq Stock Market – the second-largest stock exchange in the world. Over half of all stocks on the NASDAQ are tech stocks. The tech-driven Nasdaq ended the week down 1.64%, closing at 19,627.44 vs. the prior week of 19,954.30.
The S&P 500 large-cap index is a market-capitalization-weighted index of 500 leading publicly traded companies in the U.S. The S&P 500 is regarded as one of the best gauges of prominent American equities’ performance, and by extension, that of the stock market overall. The S&P 500 ended the week down 1.00%, closing at 6040.53 compared to last week’s 6101.24.
The S&P 400 mid-cap index is the benchmark index made up of 400 stocks that broadly represent companies with midrange market capitalization between $3.6 billion and $13.1 billion. It is used by investors as a gauge for market performance and directional trends in U.S. stocks. The S&P 400 mid-cap ended the week down 1.12%, closing at 3239.04 compared to last week’s 3275.64.
The Russell 2000 (RUT) small-cap index measures the performance of the 2,000 smaller companies included in the Russell 3000 Index. The Russell 2000 is managed by London’s FTSE Russell Group and is widely regarded as a leading indicator of the U.S. economy because of its focus on smaller companies that focus on the U.S. market. The Russell 2000 ended the week down 0.87%, closing at 2287.69 compared to last week’s 2307.74.
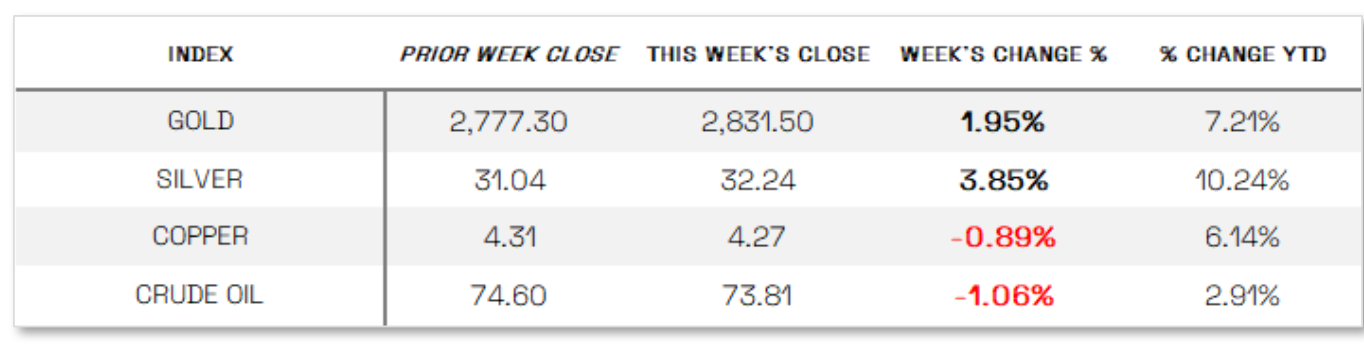
U.S. Commodities/Futures:
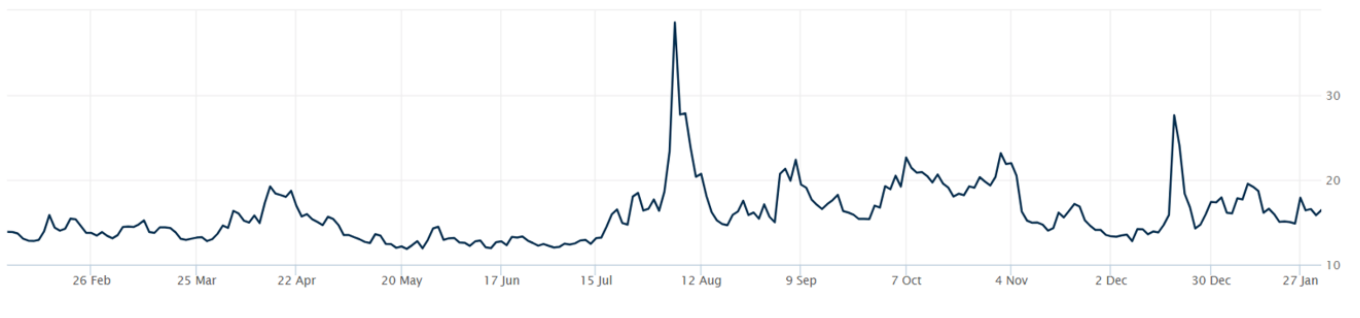
THE VOLATILITY INDEX (VIX) closed at 16.43 this week, a 10.6% increase vs last week’s close of 14.85.
International Markets:
U.S. Economic News: Fed holds rates steady: The Federal Reserve held its policy rate steady at 4.25% to 4.50% following its first 2025 meeting, citing solid economic growth, a strong labor market, and persistently elevated inflation. Fed Chair Jerome Powell emphasized that policymakers are in no rush to adjust rates and would need to see significant progress on inflation or labor market weakness before considering cuts. Supporting this stance, the Commerce Department reported that core PCE inflation, the Fed’s preferred measure, remained at 2.8% year over year in December, well above the 2% target. Additionally, U.S. GDP grew at an annualized 2.3% in the fourth quarter and 2.8% for the full year, slightly below expectations but exceeding the Fed’s long-run forecast, driven by consumer and government spending.
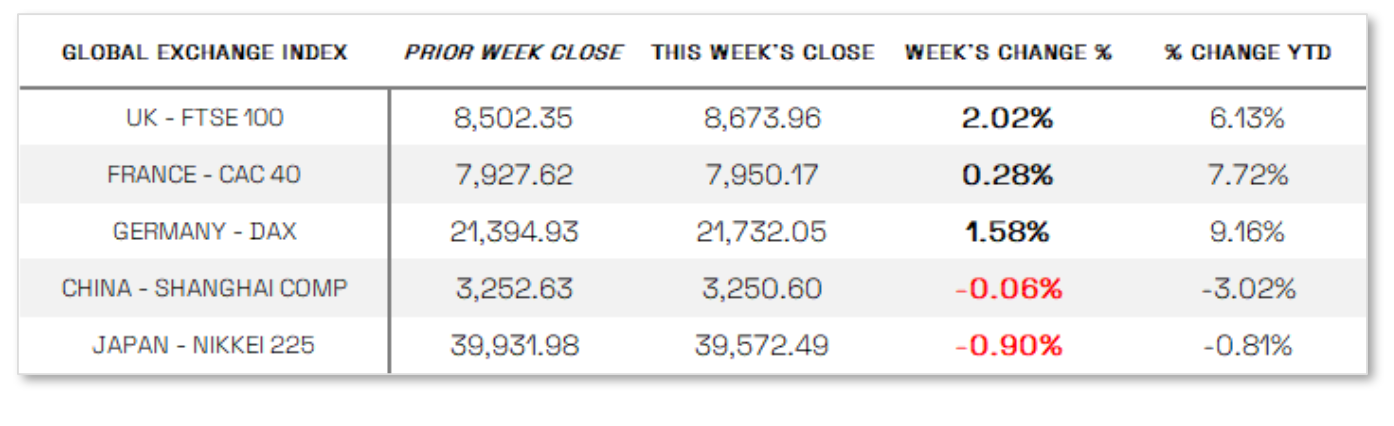
International Economic News: EUROPE: The pan-European STOXX Europe 600 Index gained 1.78% in local currency, reaching a record high as strong earnings and the European Central Bank’s (ECB) decision to cut interest rates lifted investor sentiment. Germany’s DAX rose 1.58% to a new intraday peak, while Italy’s FTSE MIB and France’s CAC 40 added 0.75% and 0.28%, respectively. The UK’s FTSE 100 climbed 2.02%, supported by a weaker pound. As expected, the ECB cut its key deposit rate by 25 basis points to 2.75%, with President Christine Lagarde affirming that disinflation is on track but refraining from signaling further rate cuts. Meanwhile, the eurozone economy stagnated in Q4, missing expectations, though full-year growth of 0.7% aligned with ECB forecasts. Germany and France saw contractions, Italy’s GDP was flat, and Spain grew 0.8%. Inflation slowed to 1.8% in France, remained at 2.8% in Germany, and accelerated to 2.9% in Spain.
JAPAN: Japan’s stock markets had a mixed week, with the Nikkei 225 falling 0.90% while the broader TOPIX Index gained 1.37%, as a sell-off in major tech stocks—triggered by concerns over Chinese AI firm DeepSeek—hit Japanese chip companies. Domestic stocks also faced pressure from the Bank of Japan’s (BoJ) hawkish stance, as it raised rates for the third time in a year and revised inflation forecasts upward. BoJ officials reaffirmed their commitment to gradual rate hikes, which helped strengthen the yen to the high end of the JPY 154 range against the U.S. dollar. Meanwhile, the 10-year Japanese government bond yield held steady at 1.23%, near a 14-year high. Economic data showed Tokyo’s core consumer price index rose 2.5% year over year in January, reinforcing expectations for further BoJ tightening, though a weak growth outlook suggests a cautious approach to future rate hikes.
CHINA: Mainland Chinese stock markets edged lower in a holiday-shortened week, with the CSI 300 and Shanghai Composite Index declining on Monday before the Lunar New Year break, which closes mainland markets until February 5. In Hong Kong, the Hang Seng Index posted slight gains before shutting for the remainder of the week. Government data signaled a weak start to 2025, as the official manufacturing PMI unexpectedly fell to 49.1 in January, while the non-manufacturing PMI dropped to 50.2 from 52.2 in December. Though seasonal factors often soften manufacturing activity in January, other data pointed to broader economic struggles, with industrial profits falling 3.3% in 2024—the third consecutive annual decline—highlighting ongoing deflationary pressures and a prolonged real estate downturn that continues to weigh on domestic demand.
Sources:
>> All index and returns data from Norgate Data and Commodity Systems Incorporated and Wall Street Journal.
>> News from Reuters, Barron’s, Wall St. Journal, Bloomberg.com, ft.com, guggenheimpartners.com, zerohedge.com, ritholtz.com, markit.com, financialpost.com, Eurostat, Statistics Canada, Yahoo! Finance, stocksandnews.com, marketwatch.com, visualcapitalist.com, wantchinatimes.com, BBC, 361capital.com, pensionpartners.com, cnbc.com, FactSet, Morningstar/Ibbotson Associates, Corporate Finance Institute.
>> Commentary from T Rowe Price Global markets weekly update — https://www.troweprice.com/personal-investing/resources/insights/global-markets-weekly-update.html
Disclosures: This material and any mention of specific investments is provided for informational purposes only and is not intended to be investment advice or a recommendation to take any action. The forecasts or forward-looking statements are based on assumptions, may not materialize, and are subject to revision without notice. The market indexes discussed are unmanaged, and generally, considered representative of their respective markets. Index performance is not indicative of the past performance of a particular investment. Indexes do not incur management fees, costs, and expenses. Individuals cannot directly invest in unmanaged indexes. Past performance does not guarantee future results.
