


The very big picture (a historical perspective): The CAPE is now at 38.47.
The long-term valuation of the market is commonly measured by the Cyclically Adjusted Price to Earnings ratio, or “CAPE”, which smooths-out shorter-term earnings swings in order to get a longer-term assessment of market valuation. In the past, the CAPE ratio has proved its importance in identifying potential bubbles and market crashes. An extremely high CAPE ratio means that a company’s stock price is substantially higher than the company’s earnings would indicate and, therefore, overvalued. It is generally expected that the market will eventually correct the company’s stock price by pushing it down to its true value. The historical average of the ratio for the S&P 500 Index is between 15-16, while the highest levels of the ratio have exceeded 30.
The record-high levels occurred three times in the history of the U.S. financial markets. The first was in 1929 before the Wall Street crash that signaled the start of the Great Depression. The second was in the late 1990s before the Dotcom Crash, and the third came in 2007 before the 2007-2008 Financial Crisis. https://www.multpl.com/shiller-pe
HISTORY OF THE CAPE VALUE FROM 1871 TO PRESENT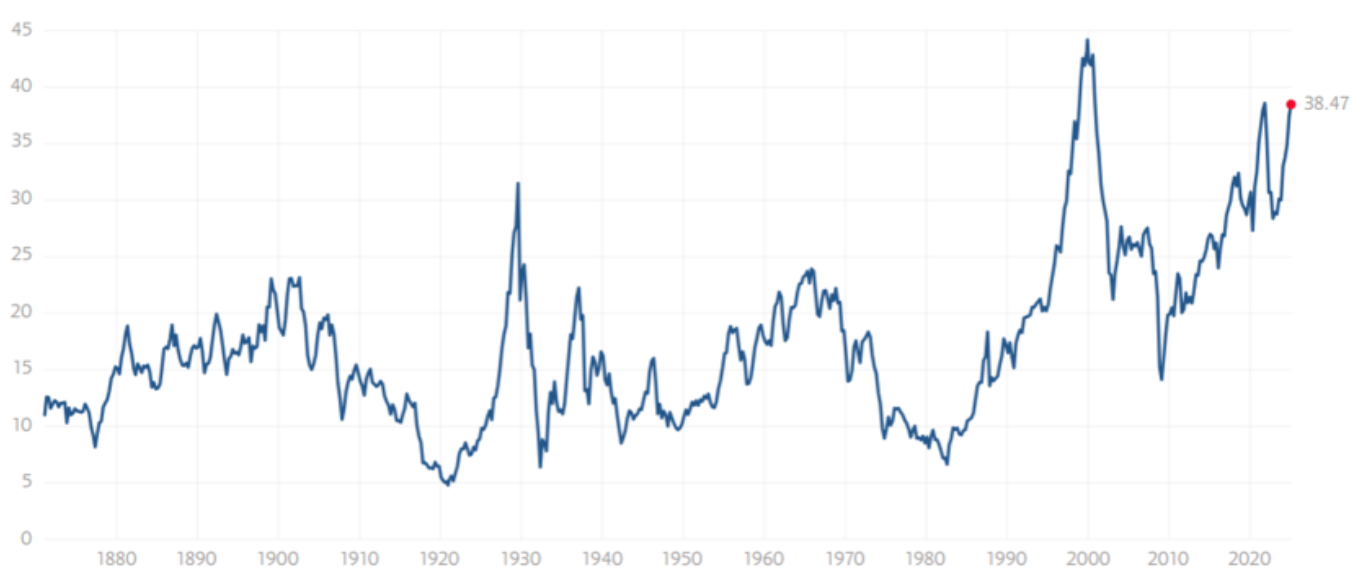
Note: We do not use CAPE as an official input into our methods. However, we think history serves as a guide and that it’s good to know where we are on the historic continuum. https://www.multpl.com/shiller-pe
The big picture: The ‘big picture’ is the (typically) years-long timeframe, the same timeframe in which Cyclical Bulls and Bears operate. The Sherman Portfolios DELTA-V Indicator measuring the Bull/Bear cycle finished the week in BULL status at 62.46, up 2.39% from the prior week’s 61.00. It has signaled Bull since April 21, 2023. The Sherman Portfolios DELTA-V Bond Indicator measuring the Bull/Bear cycle finished the week in BULL status at 48.37, up 1.00% from the prior week’s 47.89. It has signaled Bull since December 15, 2023.
The shorter term picture: GALACTIC SHIELD — POSITIVE for Q1 2025, indicating positive prospects for equities in the first quarter of 2025. This indicator is based on the combination of U.S. and International Equities trend statuses at the start of each quarter. STARFLUX— POSITIVE, Starflux ended the week at 7.23 (up 34.89% last week) This short-term indicator measures U.S. Equities. STARPATH — POSITIVE, This indicator measures the interplay on dual timeframes of our Type 1s + the Russell 3000 + our four most ‘pro-cyclical’ Type 3s, vs. Cash.
The complete picture (four indicators across three timeframes): When all four of the Sherman Portfolios indicators are in a POSITIVE status, we read the market as being in a BULL MARKET.
1. DELTA-V — Positive
2. GALACTIC SHIELD — Positive
3. STARFLUX— Positive
4. STARPATH — Positive
THIS WEEK IN THE MARKETS
U.S. Markets: Stocks up this week over trade enthusiasm:
Stocks climbed toward record highs last week, driven by optimism over softer tariffs and enthusiasm for artificial intelligence. The S&P 500 hit a new high on Thursday before dipping slightly on Friday, while growth stocks outperformed value shares for the first time this year, and large-cap indexes generally led over smaller caps. Political developments following President Donald Trump’s inauguration dominated headlines, with investors relieved that he did not impose immediate tariffs but instead ordered a review of trade policies, though he pledged 25% tariffs on Canada and Mexico by February. His remarks about preferring not to use tariffs on China further fueled trade deal hopes. Additionally, AI-related stocks surged after Trump announced Stargate, a joint venture between SoftBank, OpenAI, Oracle, and MGX, aiming to invest $500 billion in U.S. AI infrastructure, boosting market enthusiasm.
Looking at the US Indexes:
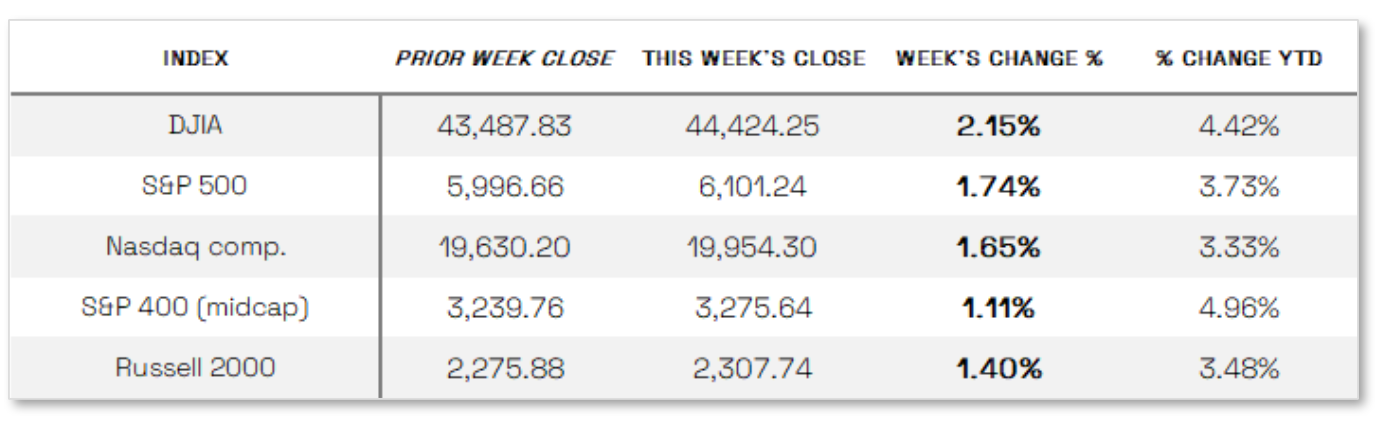
The Dow Jones Industrial Average (DJIA) is the oldest continuing U.S. market index with over 100 years of history and is made up of 30 highly reputable “blue-chip” U.S. stocks (e.g. Coca-Cola Co., Microsoft). The Dow ended the week up 2.15% at 44,424.25 vs the prior week of 43,487.83.
The Nasdaq Composite Index tracks most of the stocks listed on the Nasdaq Stock Market – the second-largest stock exchange in the world. Over half of all stocks on the NASDAQ are tech stocks. The tech-driven Nasdaq ended the week up 1.65%, closing at 19,954.30 vs. the prior week of 19,630.20.
The S&P 500 large-cap index is a market-capitalization-weighted index of 500 leading publicly traded companies in the U.S. The S&P 500 is regarded as one of the best gauges of prominent American equities’ performance, and by extension, that of the stock market overall. The S&P 500 ended the week up 1.74%, closing at 6101.24 compared to last week’s 5996.66.
The S&P 400 mid-cap index is the benchmark index made up of 400 stocks that broadly represent companies with midrange market capitalization between $3.6 billion and $13.1 billion. It is used by investors as a gauge for market performance and directional trends in U.S. stocks. The S&P 400 mid-cap ended the week up 1.11%, closing at 3275.64 compared to last week’s 3239.76.
The Russell 2000 (RUT) small-cap index measures the performance of the 2,000 smaller companies included in the Russell 3000 Index. The Russell 2000 is managed by London’s FTSE Russell Group and is widely regarded as a leading indicator of the U.S. economy because of its focus on smaller companies that focus on the U.S. market. The Russell 2000 ended the week up 1.40%, closing at 2307.74 compared to last week’s 2275.88.
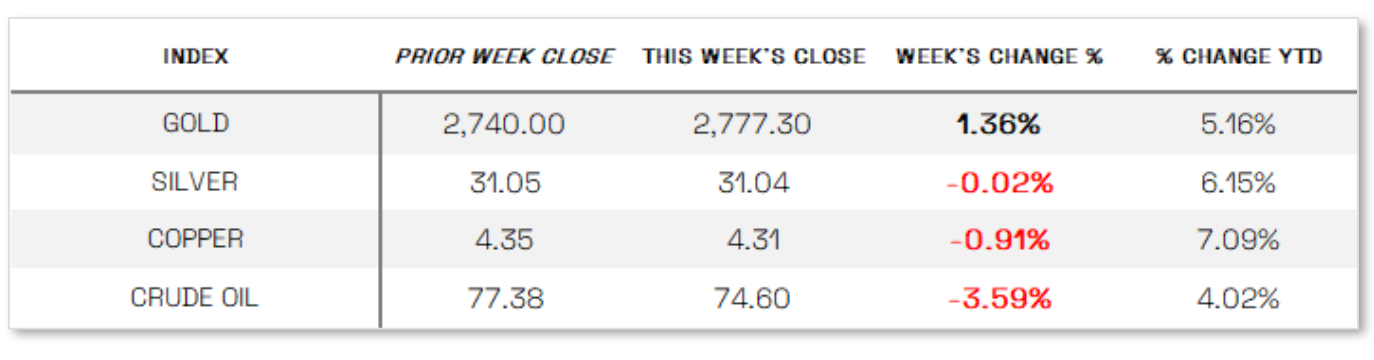
U.S. Commodities/Futures:
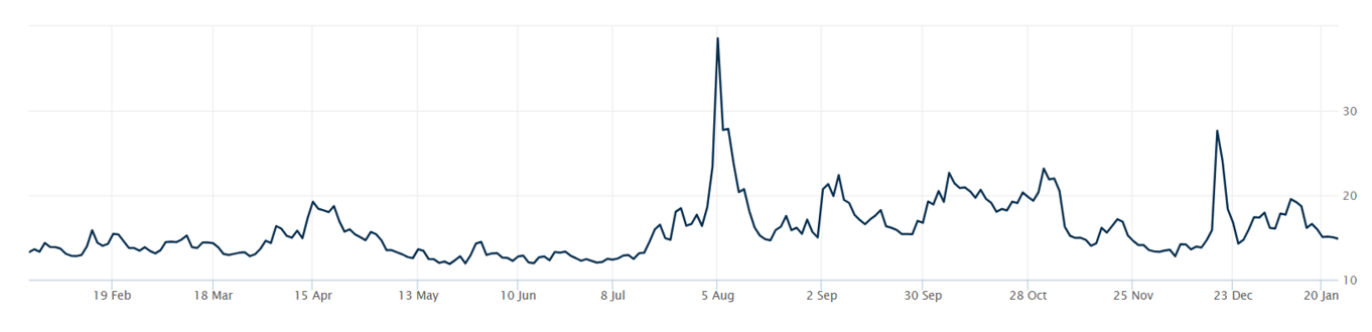
THE VOLATILITY INDEX (VIX) closed at 14.85 this week, a 7.0% decrease vs last week’s close of 15.97.
International Markets:
U.S. Economic News: Mixed economic data: Manufacturing activity rebounded in January for the first time in six months, according to S&P Global’s initial estimate, though overall business growth slowed while services expanded at a reduced pace. The National Association of Realtors reported a 2.2% rise in December existing home sales, reaching a 10-month high, but full-year sales fell to their lowest level in nearly 30 years due to high mortgage rates and record prices. Meanwhile, consumer sentiment weakened for the first time in six months, as the University of Michigan’s index dropped to 71.1 from 74.0 in December, reflecting rising inflation expectations and job market concerns.
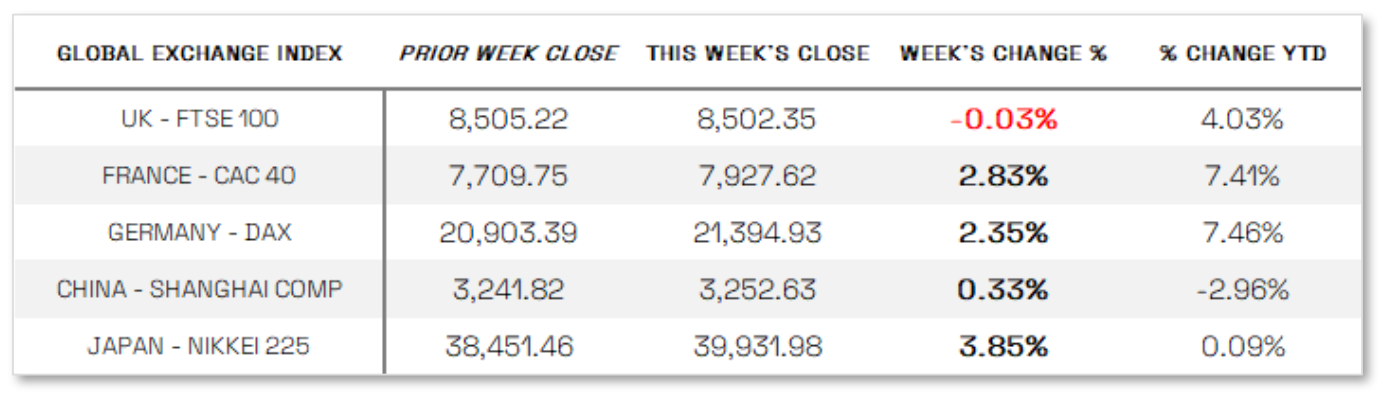
International Economic News: EUROPE: The pan-European STOXX Europe 600 Index rose 1.23% after U.S. President Trump refrained from announcing new tariffs, while expectations of further European Central Bank (ECB) rate cuts also boosted sentiment. France’s CAC 40 climbed 2.83%, Germany’s DAX gained 2.35%, but Italy’s FTSE MIB dipped 0.18%, and the UK’s FTSE 100 remained largely unchanged. Meanwhile, eurozone business activity showed slight growth in January, with the composite output index rising to 50.2 from 49.6, as services expanded modestly and manufacturing remained in contraction, though optimism for future output improved. The ECB appeared on course to ease policy further, with President Christine Lagarde hinting at gradual rate cuts, while French central bank head Francois Villeroy and Dutch governor Klaas Knot signaled potential reductions in January and March, reinforcing expectations that rates could fall quickly as inflation slows toward the 2% target.
JAPAN: Japan’s stock markets advanced as exporters benefited from U.S. President Trump’s decision not to impose new tariffs, with the Nikkei 225 climbing 3.85% and the TOPIX gaining 2.67%, though yen appreciation to the high JPY 155 range against the USD posed a slight headwind. The yen strengthened further after Japan’s finance minister signaled readiness to support the currency and the Bank of Japan (BoJ) took a hawkish stance by raising its policy rate for the third time in a year, bringing it to 0.5%—the highest since 2008. The BoJ also revised its inflation expectations upward for 2025, with all measures exceeding the 2% target, fueling speculation of another rate hike in the second half of the year. Additionally, Japan’s core consumer price index rose 3.0% year over year in December, reinforcing expectations of continued monetary policy normalization.
CHINA: Chinese equities advanced as optimism grew over a potentially softer stance from President Trump on tariffs, with the Shanghai Composite rising 0.33%, the CSI 300 gaining 0.54%, and Hong Kong’s Hang Seng Index climbing 2.46%. Meanwhile, Chinese banks held their one- and five-year loan prime rates steady at 3.1% and 3.6% for the third consecutive month, following a larger-than-expected rate cut in October aimed at economic recovery. Analysts expect further monetary easing, including potential reserve requirement and interest rate cuts, as Beijing seeks to counter market uncertainty under a second Trump administration. On the labor front, China’s youth unemployment rate fell for the fourth straight month to 15.7% in December from 16.1% in November, though the overall jobless rate edged up slightly to 5.1% from 5.0%.
Sources:
>> All index and returns data from Norgate Data and Commodity Systems Incorporated and Wall Street Journal.
>> News from Reuters, Barron’s, Wall St. Journal, Bloomberg.com, ft.com, guggenheimpartners.com, zerohedge.com, ritholtz.com, markit.com, financialpost.com, Eurostat, Statistics Canada, Yahoo! Finance, stocksandnews.com, marketwatch.com, visualcapitalist.com, wantchinatimes.com, BBC, 361capital.com, pensionpartners.com, cnbc.com, FactSet, Morningstar/Ibbotson Associates, Corporate Finance Institute.
>> Commentary from T Rowe Price Global markets weekly update — https://www.troweprice.com/personal-investing/resources/insights/global-markets-weekly-update.html
Disclosures: This material and any mention of specific investments is provided for informational purposes only and is not intended to be investment advice or a recommendation to take any action. The forecasts or forward-looking statements are based on assumptions, may not materialize, and are subject to revision without notice. The market indexes discussed are unmanaged, and generally, considered representative of their respective markets. Index performance is not indicative of the past performance of a particular investment. Indexes do not incur management fees, costs, and expenses. Individuals cannot directly invest in unmanaged indexes. Past performance does not guarantee future results.
