


The very big picture (a historical perspective): The CAPE is now at 36.98.
The long-term valuation of the market is commonly measured by the Cyclically Adjusted Price to Earnings ratio, or “CAPE”, which smooths-out shorter-term earnings swings in order to get a longer-term assessment of market valuation. In the past, the CAPE ratio has proved its importance in identifying potential bubbles and market crashes. An extremely high CAPE ratio means that a company’s stock price is substantially higher than the company’s earnings would indicate and, therefore, overvalued. It is generally expected that the market will eventually correct the company’s stock price by pushing it down to its true value. The historical average of the ratio for the S&P 500 Index is between 15-16, while the highest levels of the ratio have exceeded 30.
The record-high levels occurred three times in the history of the U.S. financial markets. The first was in 1929 before the Wall Street crash that signaled the start of the Great Depression. The second was in the late 1990s before the Dotcom Crash, and the third came in 2007 before the 2007-2008 Financial Crisis. https://www.multpl.com/shiller-pe
HISTORY OF THE CAPE VALUE FROM 1871 TO PRESENT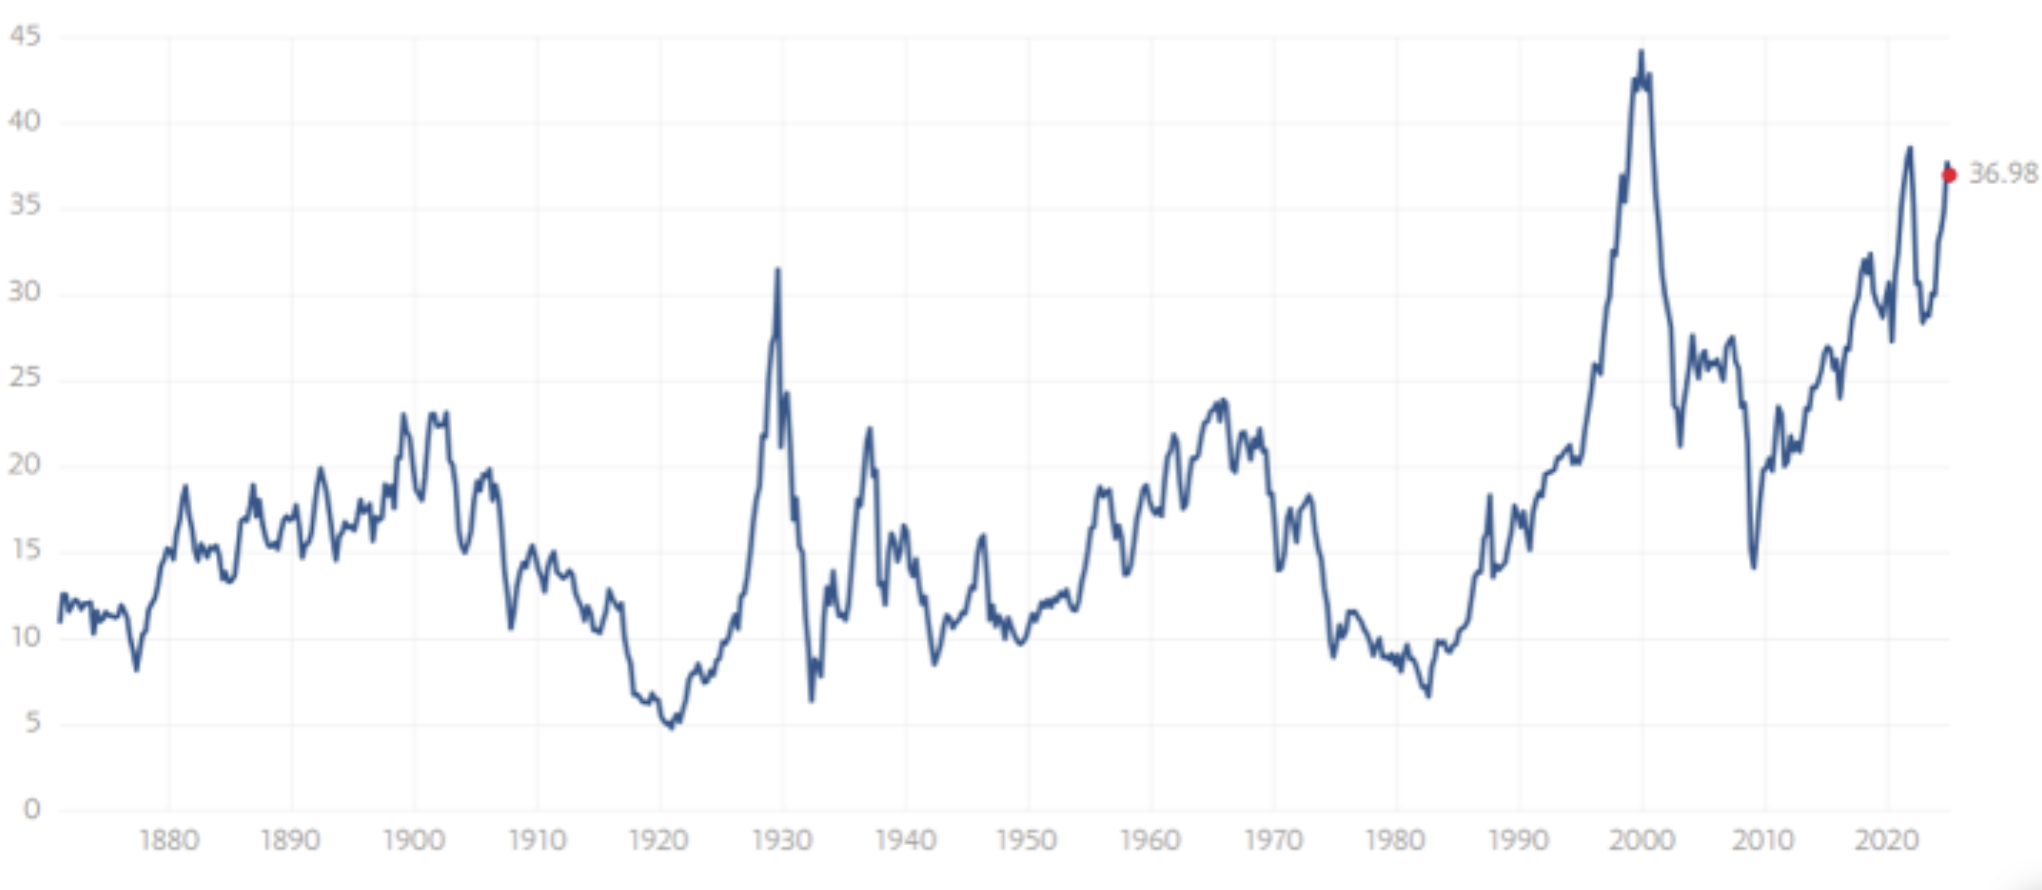
Note: We do not use CAPE as an official input into our methods. However, we think history serves as a guide and that it’s good to know where we are on the historic continuum. https://www.multpl.com/shiller-pe
The big picture: The ‘big picture’ is the (typically) years-long timeframe, the same timeframe in which Cyclical Bulls and Bears operate. The Sherman Portfolios DELTA-V Indicator measuring the Bull/Bear cycle finished the week in BULL status at 60.33, down 5.72% from the prior week’s 63.99. It has signaled Bull since April 21, 2023. The Sherman Portfolios DELTA-V Bond Indicator measuring the Bull/Bear cycle finished the week in BULL status at 47.51, down 2.44% from the prior week’s 48.70. It has signaled Bull since December 15, 2023.
The shorter term picture: GALACTIC SHIELD — POSITIVE for Q1 2025, indicating positive prospects for equities in the first quarter of 2025. This indicator is based on the combination of U.S. and International Equities trend statuses at the start of each quarter. STARFLUX— POSITIVE, Starflux ended the week at 2.10 (down 50% last week) This short-term indicator measures U.S. Equities. STARPATH — POSITIVE, This indicator measures the interplay on dual timeframes of our Type 1s + the Russell 3000 + our four most ‘pro-cyclical’ Type 3s, vs. Cash.
The complete picture (four indicators across three timeframes): When all four of the Sherman Portfolios indicators are in a POSITIVE status, we read the market as being in a BULL MARKET.
1. DELTA-V — Positive
2. GALACTIC SHIELD — Positive
3. STARFLUX— Positive
4. STARPATH — Positive
THIS WEEK IN THE MARKETS
U.S. Markets: Stocks down this week: U.S. equities declined during the week, shortened by a market closure on Thursday in honor of former President Jimmy Carter’s passing, with small-cap stocks underperforming large caps for the fifth time in six weeks as the Russell 2000 Index dipped into correction territory. While value stocks outperformed growth stocks, the Nasdaq Composite recorded its steepest weekly drop since mid-November, falling 2.34%. The week began on a positive note after reports suggested the incoming Trump administration might adopt a softer stance on tariffs, lifting most indexes on Monday. However, optimism waned as President-elect Trump refuted these reports and economic data heightened inflation concerns. It is reasonable to expect choppy market conditions and anticipated continued volatility in the coming weeks amid corporate earnings releases, policy updates from the new administration, and Federal Reserve outlooks.
Looking at the US Indexes:
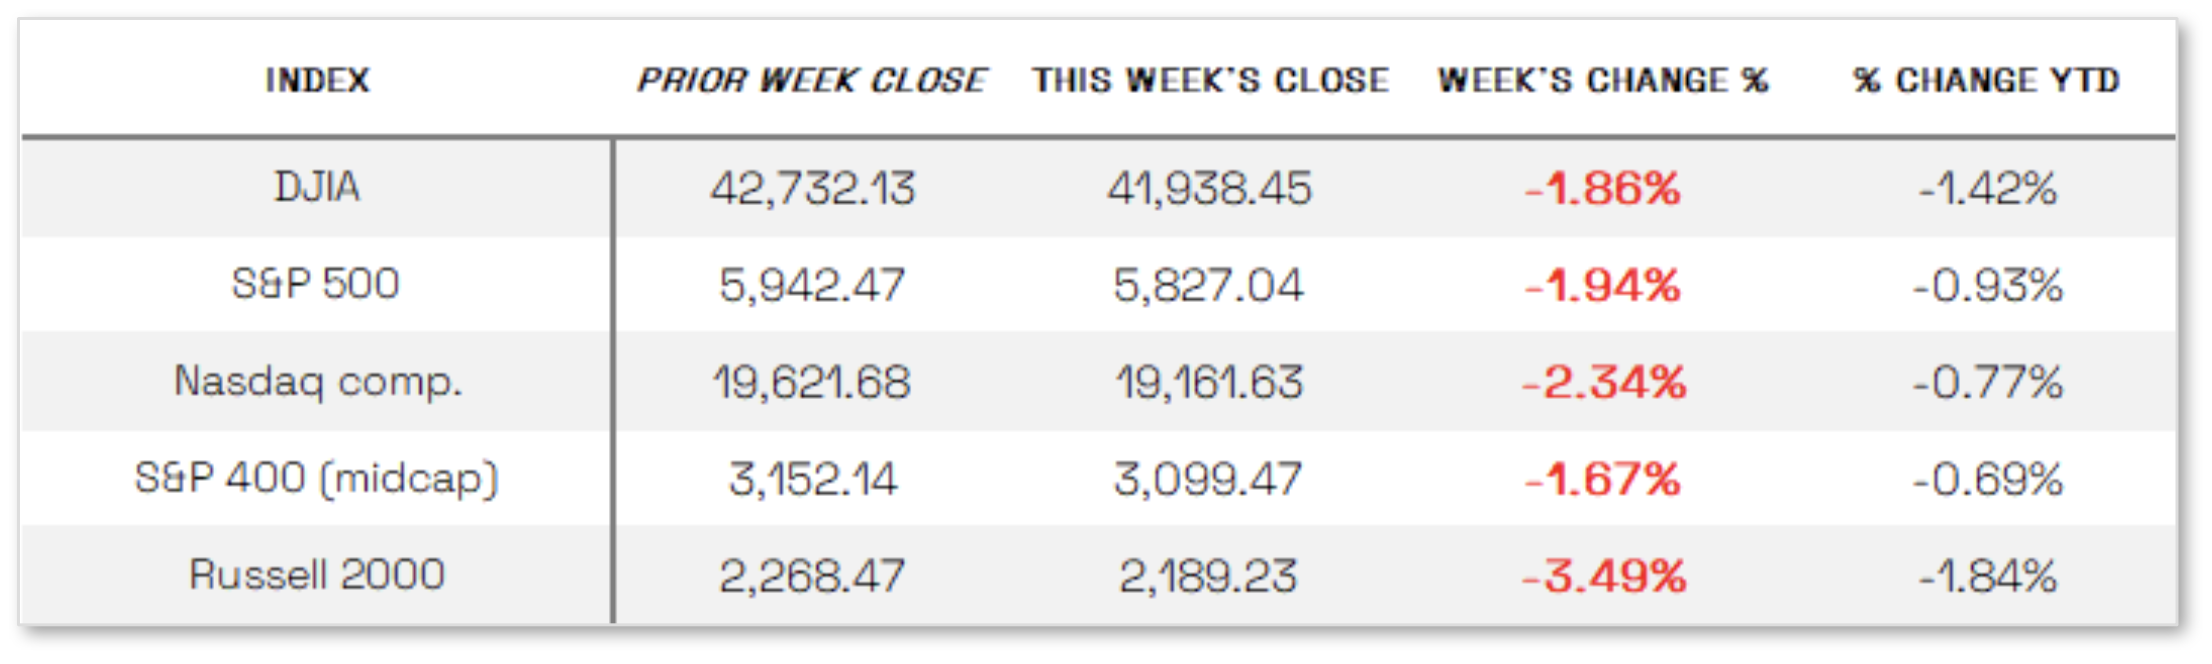
The Dow Jones Industrial Average (DJIA) is the oldest continuing U.S. market index with over 100 years of history and is made up of 30 highly reputable “blue-chip” U.S. stocks (e.g. Coca-Cola Co., Microsoft). The Dow ended the week down 1.86% at 41,938.45 vs the prior week of 42,732.13.
The Nasdaq Composite Index tracks most of the stocks listed on the Nasdaq Stock Market – the second-largest stock exchange in the world. Over half of all stocks on the NASDAQ are tech stocks. The tech-driven Nasdaq ended the week down 2.34%, closing at 19,161.63 vs. the prior week of 19,621.68.
The S&P 500 large-cap index is a market-capitalization-weighted index of 500 leading publicly traded companies in the U.S. The S&P 500 is regarded as one of the best gauges of prominent American equities’ performance, and by extension, that of the stock market overall. The S&P 500 ended the week down 1.94%, closing at 5827.04 compared to last week’s 5942.47.
The S&P 400 mid-cap index is the benchmark index made up of 400 stocks that broadly represent companies with midrange market capitalization between $3.6 billion and $13.1 billion. It is used by investors as a gauge for market performance and directional trends in U.S. stocks. The S&P 400 mid-cap ended the week down 1.67%, closing at 3099.47 compared to last week’s 3152.14.
The Russell 2000 (RUT) small-cap index measures the performance of the 2,000 smaller companies included in the Russell 3000 Index. The Russell 2000 is managed by London’s FTSE Russell Group and is widely regarded as a leading indicator of the U.S. economy because of its focus on smaller companies that focus on the U.S. market. The Russel 2000 ended the week down 3.49%, closing at 2189.23 compared to last week’s 2268.47.
U.S. Commodities/Futures:

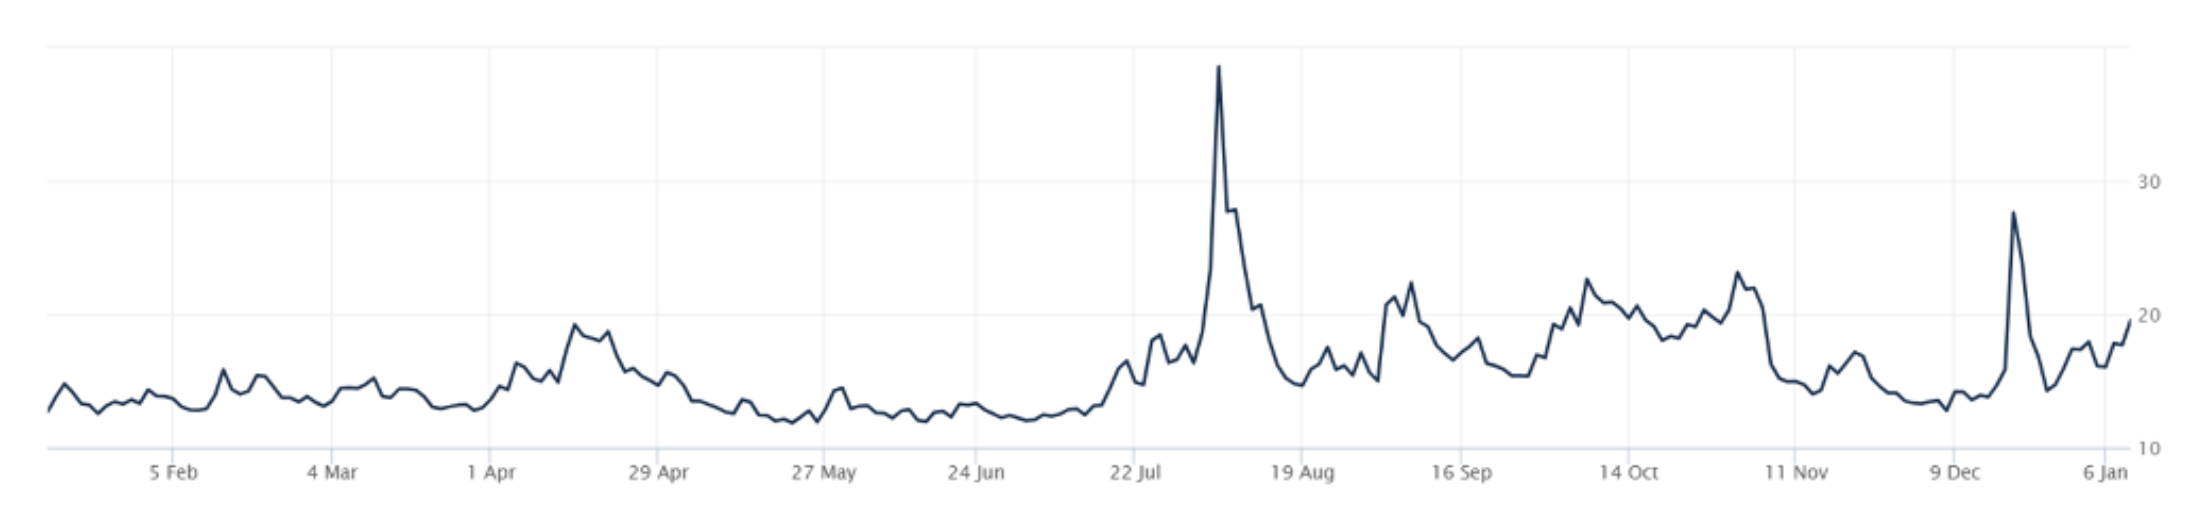
THE VOLATILITY INDEX (VIX) closed at 19.54 this week, a 21.1% increase vs last week’s close of 16.13.
International Markets:
THIS WEEK’S ECONOMIC NEWS
U.S. Economic News: Job data may slow rate cuts: Economic data releases throughout the week highlighted persistent inflation concerns and labor market resilience, fueling fears of prolonged high interest rates. On Tuesday, the Institute for Supply Management (ISM) reported its Services Purchasing Managers’ Index (PMI) at 54.1 for December, up from November’s 52.1, signaling expansion. However, the prices paid component surged by 6.2 percentage points to 64.4, raising concerns about stalled progress in reducing inflation. These fears were echoed by Federal Reserve Governor Michelle Bowman, who noted inflation remains “uncomfortably above” the Fed’s 2% target, and by the minutes of the December Fed meeting, which revealed officials’ concerns about heightened upside risks to inflation. On Friday, the Labor Department’s report showed the U.S. added 256,000 jobs in December, surpassing expectations of 155,000, with unemployment steady at 4.1% and wages growing 3.9% year over year. This robust labor market data, coupled with inflation concerns, led to sharp declines in stocks, solidifying losses for the week.
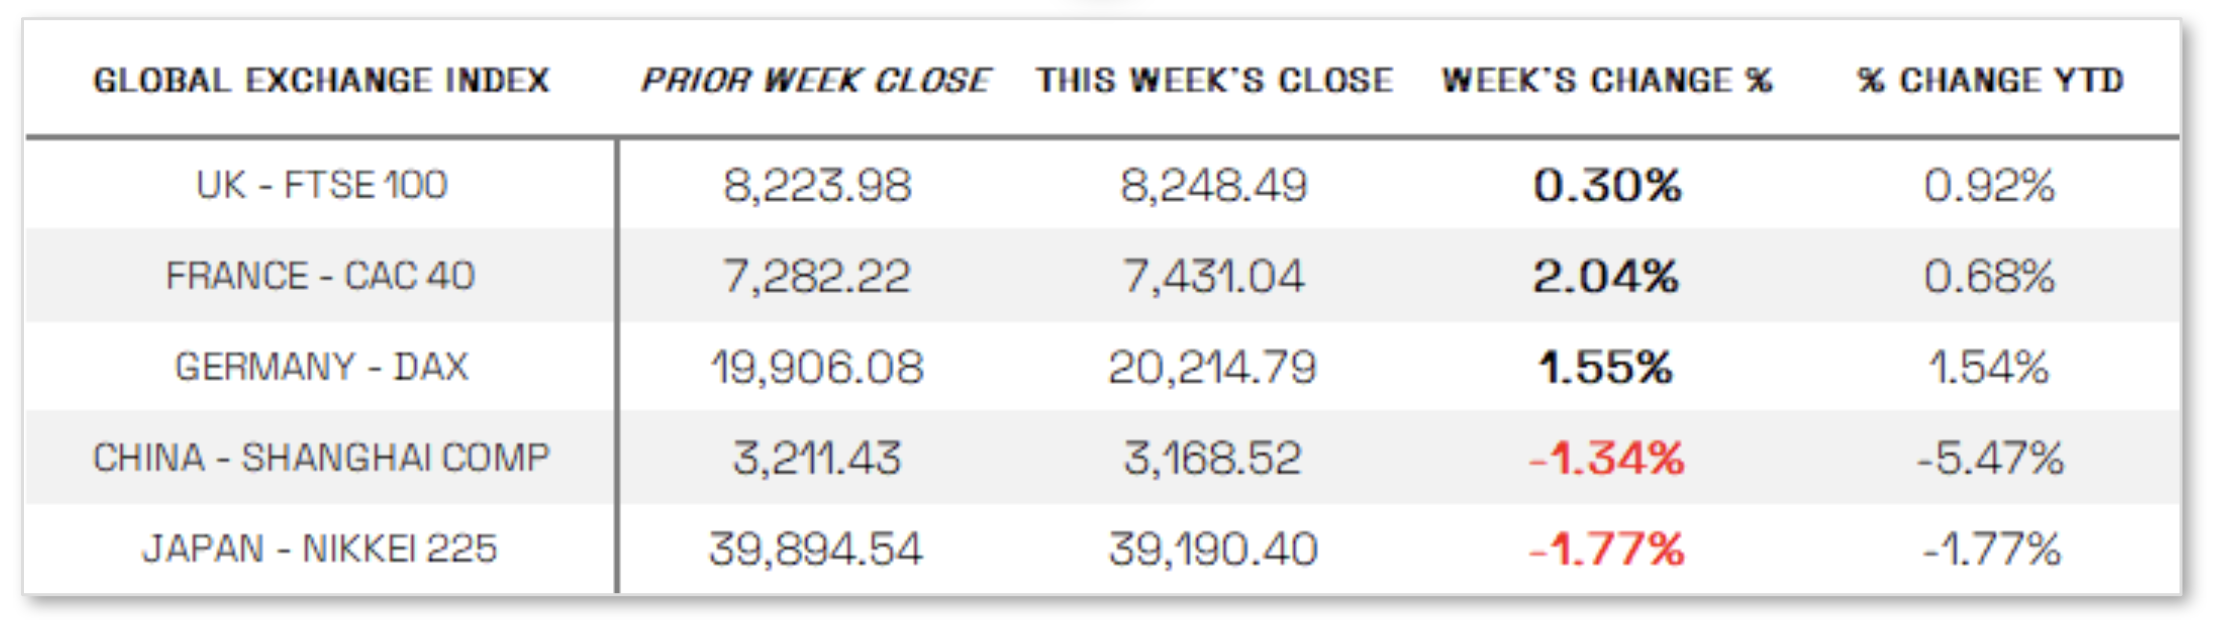
International Economic News: EUROPE: The pan-European STOXX Europe 600 Index rose 0.65% in local currency terms as investors anticipated a European Central Bank rate cut in January, despite rising inflation. Among major markets, Italy’s FTSE MIB surged 2.82%, Germany’s DAX gained 1.55%, France’s CAC 40 added 2.04%, and the UK’s FTSE 100 edged up 0.30%. In the UK, the bond market faced turbulence due to concerns over President-elect Donald Trump’s policies, a hawkish U.S. interest rate outlook, and domestic fiscal issues, pushing the 10-year gilt yield to 4.8%, the highest since August 2008. Chancellor of the Exchequer Rachel Reeves urged Cabinet colleagues to propose growth-boosting measures as fears mounted over the Labour government’s ability to manage debt levels and implement budget plans. In the eurozone, December inflation accelerated to 2.4% year over year, above the 2% target, with core inflation holding at 2.7%, while retail sales stagnated and unemployment remained at a record low of 6.3%.
JAPAN: Japan’s stock markets declined over the week, with the Nikkei 225 falling 1.77% and the TOPIX Index dropping 2.5%, amid ongoing speculation about the timing of the Bank of Japan’s (BoJ) next interest rate hike. The yen weakened to approximately JPY 158.1 against the U.S. dollar, down from 157.3 the previous week, pressured by uncertainty over the pace of the BoJ’s monetary policy normalization and a widening U.S.-Japan interest rate differential. Finance Minister Katsunobu Kato issued a warning against speculative currency moves, signaling readiness to intervene if necessary, as authorities last did in July 2024. In fixed income, the 10-year Japanese government bond (JGB) yield climbed to 1.19%, its highest level since 2011, tracking rising U.S. Treasury yields amid diminishing expectations for Federal Reserve rate cuts. BoJ Governor Kazuo Ueda maintained a tightening bias, emphasizing that rate hikes depend on improving economic and price conditions, though some investors now anticipate delays until March or April. Meanwhile, Japan’s real wage growth fell 0.3% year over year in November, marking a fourth consecutive month of decline, underscoring challenges to consumer purchasing power—a key factor for the BoJ’s policy outlook.
CHINA: Chinese stocks declined as deflationary pressures persisted in the economy, with the Shanghai Composite Index losing 1.34%, the blue-chip CSI 300 falling 1.13%, and Hong Kong’s Hang Seng Index dropping 3.52%, according to FactSet. Inflation data released Thursday showed the consumer price index rose just 0.1% year over year in December, down from November’s 0.2%, amid lower food and fuel prices, while core inflation edged up to 0.4%. The producer price index fell 2.3%, marking the 27th consecutive month of factory gate deflation, though the pace of decline slowed from November’s 2.5%. On a positive note, the Caixin/S&P Global survey of services activity rose to 52.2 in December, its highest since May, aligning with official data showing a similar increase in non-manufacturing activity following Beijing’s stimulus measures in late September. The People’s Bank of China, in its quarterly policy meeting, pledged a moderately loose monetary policy to support growth, with plans to cut the reserve requirement ratio and interest rates when appropriate, while boosting financial support for key sectors such as technology, emissions, pensions, and digital industries.
Sources:
>> All index and returns data from Norgate Data and Commodity Systems Incorporated and Wall Street Journal.
>> News from Reuters, Barron’s, Wall St. Journal, Bloomberg.com, ft.com, guggenheimpartners.com, zerohedge.com, ritholtz.com, markit.com, financialpost.com, Eurostat, Statistics Canada, Yahoo! Finance, stocksandnews.com, marketwatch.com, visualcapitalist.com, wantchinatimes.com, BBC, 361capital.com, pensionpartners.com, cnbc.com, FactSet, Morningstar/Ibbotson Associates, Corporate Finance Institute.
>> Commentary from T Rowe Price Global markets weekly update — https://www.troweprice.com/personal-investing/resources/insights/global-markets-weekly-update.html
Disclosures: This material and any mention of specific investments is provided for informational purposes only and is not intended to be investment advice or a recommendation to take any action. The forecasts or forward-looking statements are based on assumptions, may not materialize, and are subject to revision without notice. The market indexes discussed are unmanaged, and generally, considered representative of their respective markets. Index performance is not indicative of the past performance of a particular investment. Indexes do not incur management fees, costs, and expenses. Individuals cannot directly invest in unmanaged indexes. Past performance does not guarantee future results.
