


The very big picture (a historical perspective): The CAPE is now at 37.94.
The long-term valuation of the market is commonly measured by the Cyclically Adjusted Price to Earnings ratio, or “CAPE”, which smooths-out shorter-term earnings swings in order to get a longer-term assessment of market valuation. In the past, the CAPE ratio has proved its importance in identifying potential bubbles and market crashes. An extremely high CAPE ratio means that a company’s stock price is substantially higher than the company’s earnings would indicate and, therefore, overvalued. It is generally expected that the market will eventually correct the company’s stock price by pushing it down to its true value. The historical average of the ratio for the S&P 500 Index is between 15-16, while the highest levels of the ratio have exceeded 30.
The record-high levels occurred three times in the history of the U.S. financial markets. The first was in 1929 before the Wall Street crash that signaled the start of the Great Depression. The second was in the late 1990s before the Dotcom Crash, and the third came in 2007 before the 2007-2008 Financial Crisis. https://www.multpl.com/shiller-pe
HISTORY OF THE CAPE VALUE FROM 1871 TO PRESENT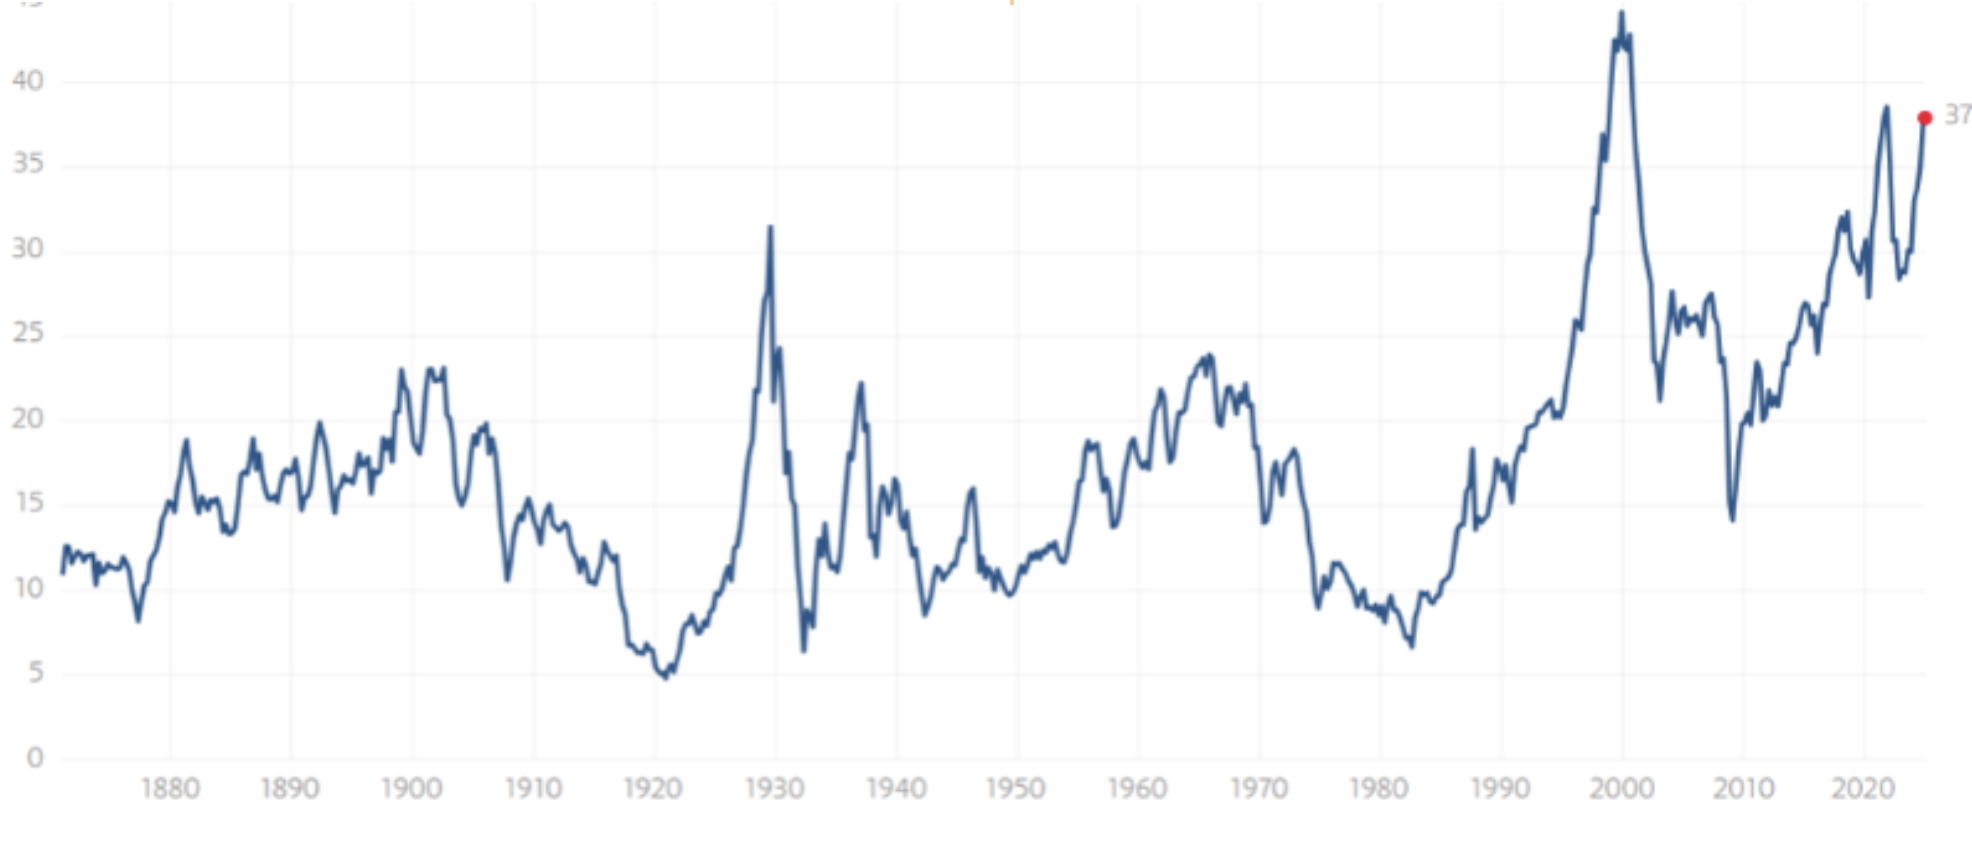
Note: We do not use CAPE as an official input into our methods. However, we think history serves as a guide and that it’s good to know where we are on the historic continuum. https://www.multpl.com/shiller-pe
The big picture: The ‘big picture’ is the (typically) years-long timeframe, the same timeframe in which Cyclical Bulls and Bears operate. The Sherman Portfolios DELTA-V Indicator measuring the Bull/Bear cycle finished the week in BULL status at 66.3, down 2.74% from the prior week’s 68.17. It has signaled Bull since April 21, 2023. The Sherman Portfolios DELTA-V Bond Indicator measuring the Bull/Bear cycle finished the week in BULL status at 49.50, down 4.57% from the prior week’s 51.87. It has signaled Bull since December 15, 2023.
The shorter term picture: GALACTIC SHIELD – POSITIVE for Q4 2024, indicating positive prospects for equities in the fourth quarter of 2024. This indicator is based on the combination of U.S. and International Equities trend statuses at the start of each quarter. STARFLUX— POSITIVE, Starflux ended the week at 4.52 (up 15.90% last week). This short-term indicator measures U.S. Equities. STARPATH — POSITIVE, This indicator measures the interplay on dual timeframes of our Type 1s + the Russell 3000 + our four most ‘pro-cyclical’ Type 3s, vs. Cash.
The complete picture (four indicators across three timeframes): When all four of the Sherman Portfolios indicators are in a POSITIVE status, we read the market as being in a BULL MARKET.
1. DELTA-V — Positive
2. GALACTIC SHIELD — Positive
3. STARFLUX— Positive
4. STARPATH — Positive
THIS WEEK IN THE MARKETS
U.S. Markets: Stocks finish up after a short week: Stocks finished the holiday-shortened week with moderate gains, driven early on by a rally in large-cap growth stocks, particularly in the technology sector, which boosted the Nasdaq Composite and the Russell 1000 Growth Index through Tuesday. Following Wednesday’s market closure for Christmas, the trend reversed, with most indexes giving back some of their earlier gains in the latter half of the week. U.S. Treasury yields rose slightly amid light holiday trading, with the 10-year note reaching an intraday high of 4.641% on Thursday, as bond prices and yields moved inversely. High-yield bonds saw modest advances on muted trading volumes, supported by equity gains and a stable macroeconomic backdrop. No new deals were announced, and the primary calendar is expected to remain quiet through year-end.
Looking at the US Indexes:
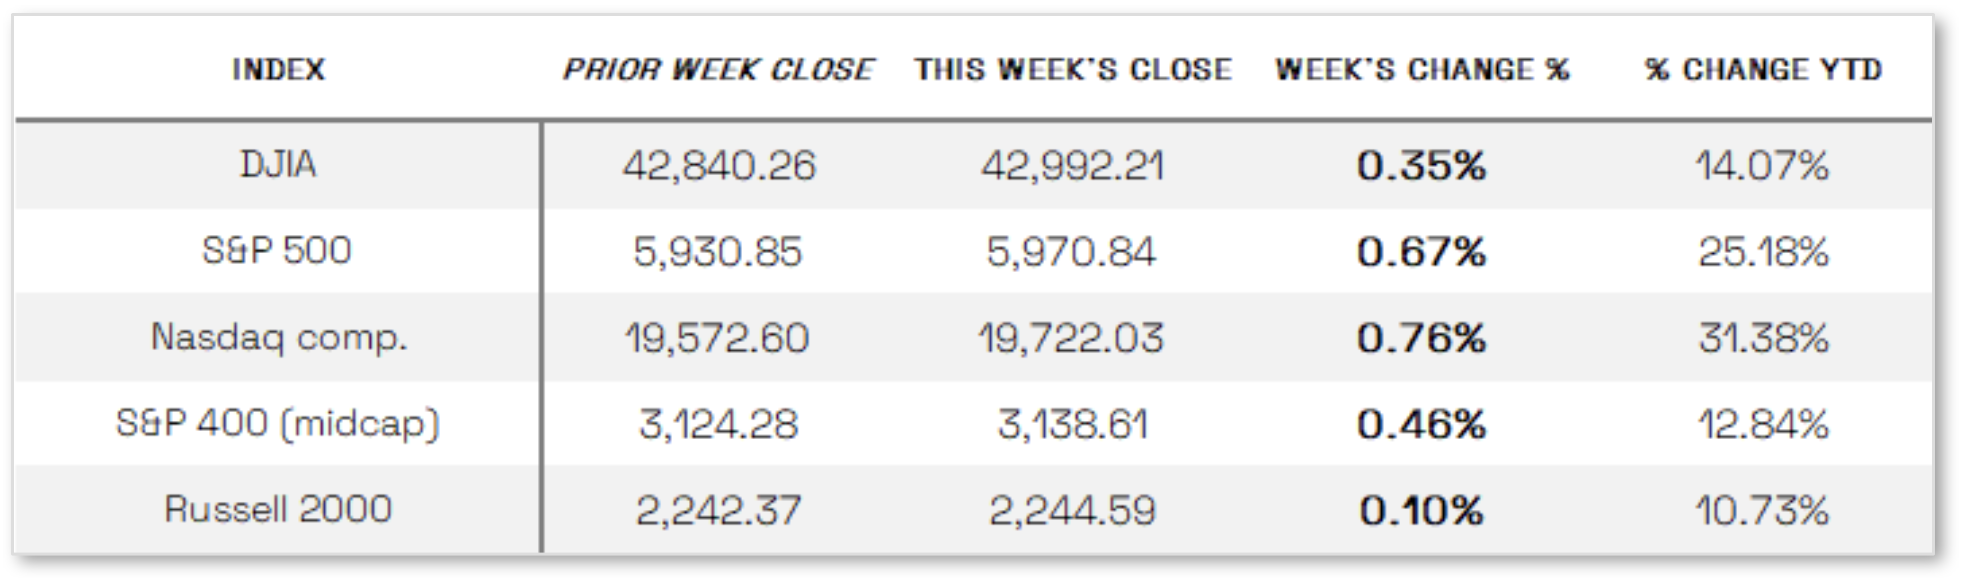
The Dow Jones Industrial Average (DJIA) is the oldest continuing U.S. market index with over 100 years of history and is made up of 30 highly reputable “blue-chip” U.S. stocks (e.g. Coca-Cola Co., Microsoft). The Dow ended the week up 0.35% at 42,992.21 vs the prior week of 42,840.26.
The Nasdaq Composite Index tracks most of the stocks listed on the Nasdaq Stock Market – the second-largest stock exchange in the world. Over half of all stocks on the NASDAQ are tech stocks. The tech-driven Nasdaq ended the week up 0.76%, closing at 19,722.03 vs. the prior week of 19,572.60.
The S&P 500 large-cap index is a market-capitalization-weighted index of 500 leading publicly traded companies in the U.S. The S&P 500 is regarded as one of the best gauges of prominent American equities’ performance, and by extension, that of the stock market overall. The S&P 500 ended the week up 0.67%, closing at 5970.84 compared to last week’s 5930.85.
The S&P 400 mid-cap index is the benchmark index made up of 400 stocks that broadly represent companies with midrange market capitalization between $3.6 billion and $13.1 billion. It is used by investors as a gauge for market performance and directional trends in U.S. stocks. The S&P 400 mid-cap ended the week up 0.46%, closing at 3138.61 compared to last week’s 3124.28
The Russell 2000 (RUT) small-cap index measures the performance of the 2,000 smaller companies included in the Russell 3000 Index. The Russell 2000 is managed by London’s FTSE Russell Group and is widely regarded as a leading indicator of the U.S. economy because of its focus on smaller companies that focus on the U.S. market. The Russel 2000 ended the week up 0.10%, closing at 2244.59 compared to last week’s 2242.37.
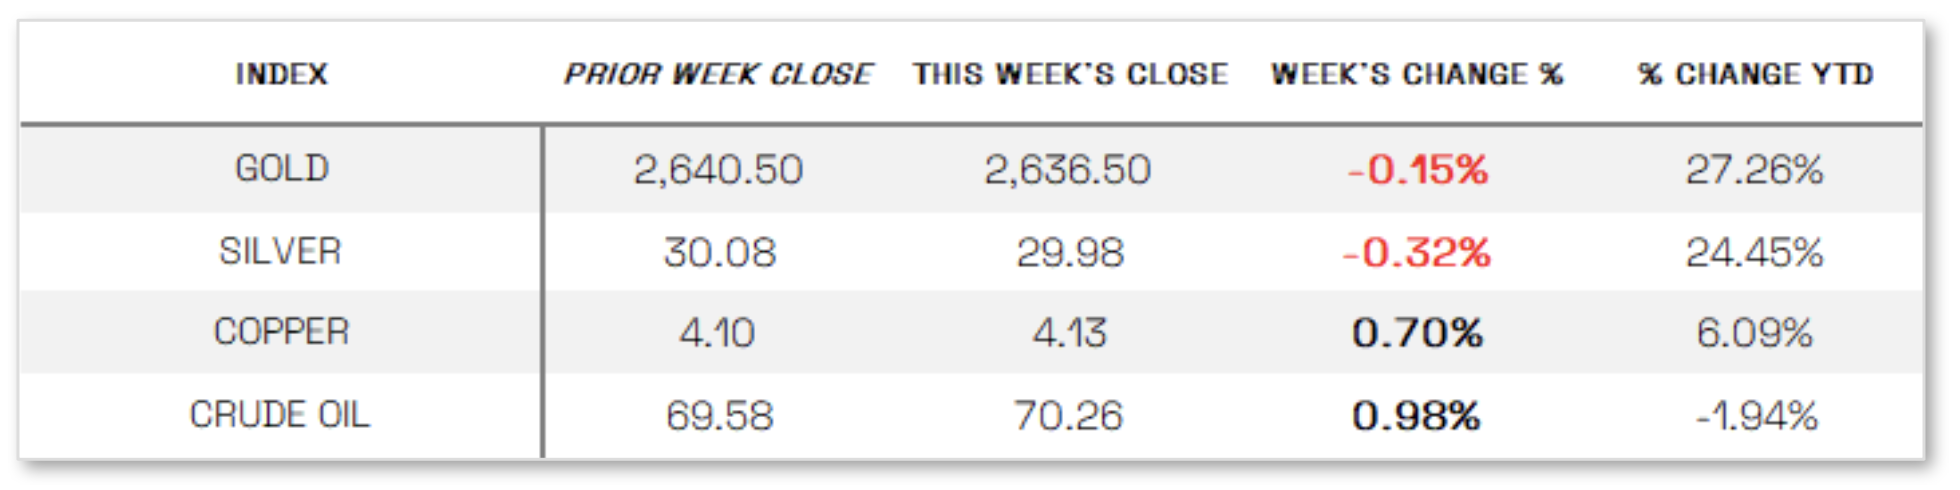
U.S. Commodities/Futures:
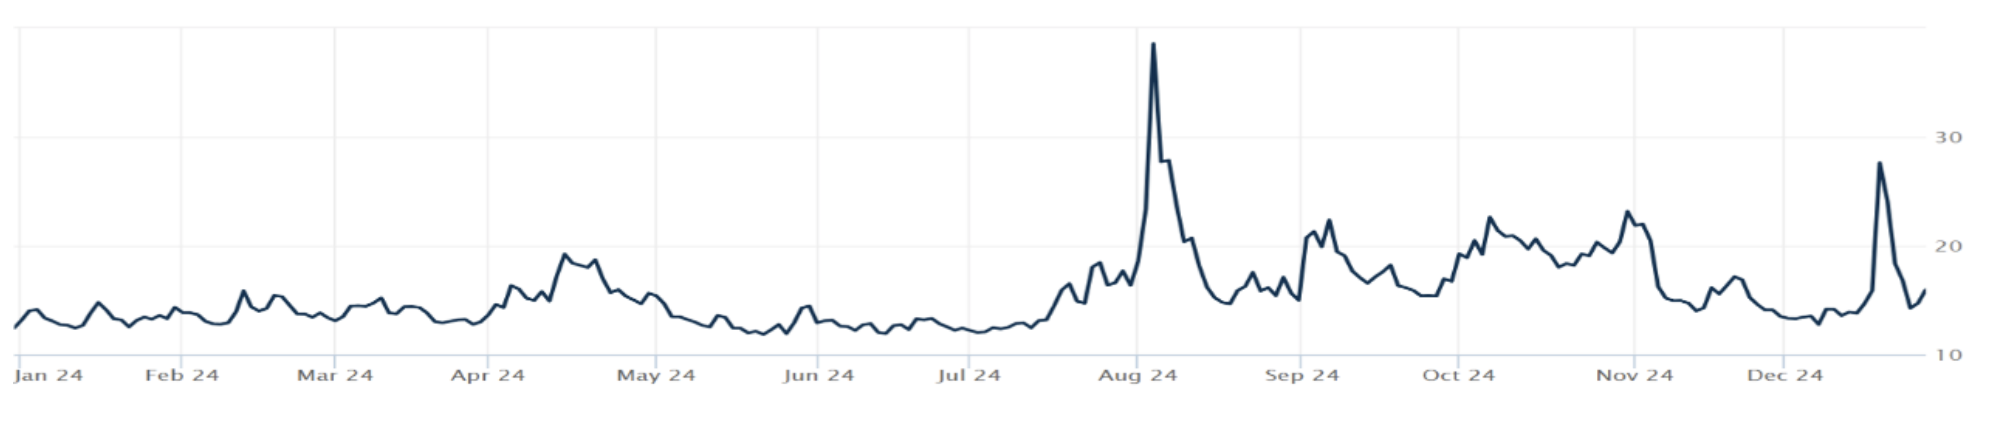
THE VOLATILITY INDEX (VIX) closed at 15.95 this week, a 13.1% decrease vs last week’s close of 18.36.
 International Markets:
THIS WEEK’S ECONOMIC NEWS
U.S. Economic News: Mixed Economic data: Consumer confidence, manufacturing activity, and initial jobless claims all showed declines, reflecting mixed economic signals. The Conference Board’s index of U.S. consumer confidence dropped to 104.7 in December from 112.8 in November, with a sharp 12.6-point fall in the expectations component, signaling concerns about income, business, and labor market conditions and approaching levels that often precede recessions. Durable goods orders for November fell 1.1%, marking the fourth decline in six months, driven by lower commercial aircraft orders and reduced defense spending. New home sales also came in slightly below expectations, with a seasonally adjusted annual pace of 664,000, though this was an improvement over October’s hurricane-impacted figures. On the labor front, initial unemployment claims fell to 219,000 for the week ended December 21, the lowest since mid-November, but continuing claims rose to 1.91 million, the highest since late 2021, indicating longer job searches for those unemployed.
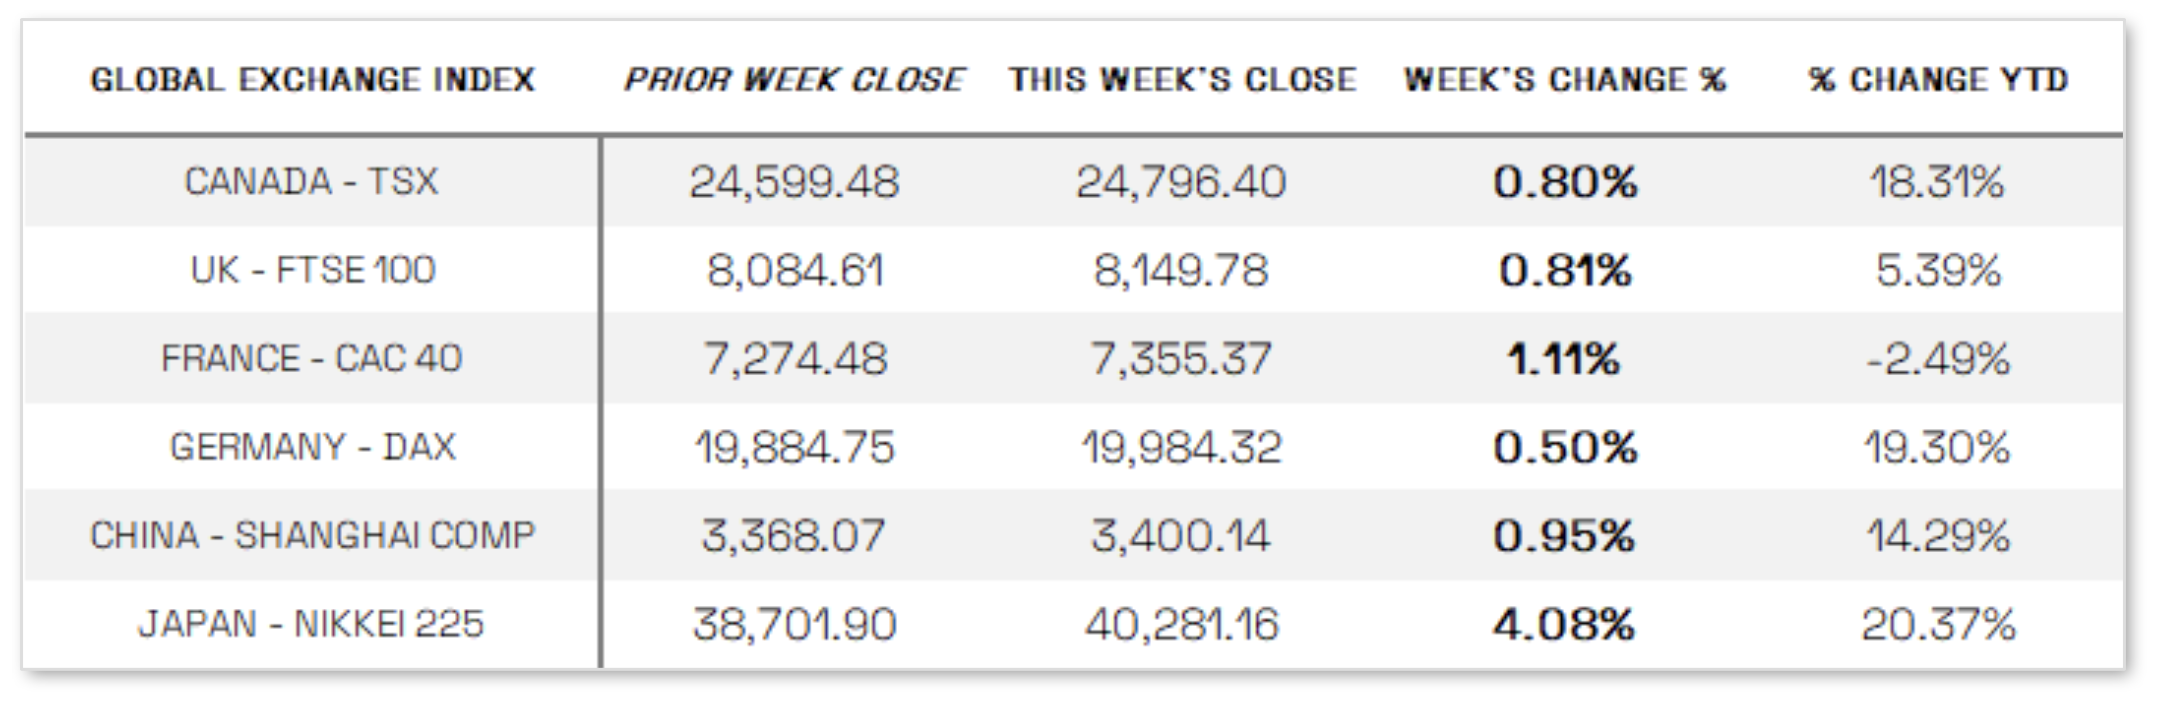
International Economic News: EUROPE: European stocks rose during the shortened holiday trading week, with the STOXX 600 Index gaining 0.99% in local currency terms, while France’s CAC 40 added 1.11% and Germany’s DAX climbed 0.50%. In the UK, the Office for National Statistics revised its third-quarter economic growth estimate to 0.0% from 0.1% and its second-quarter growth to 0.4% from 0.5%, heightening concerns about a stalled economy ahead of planned tax increases by the Labor government. Meanwhile, political developments in France saw President Emmanuel Macron appointing a new cabinet under Prime Minister Francois Bayrou after the previous government’s collapse, marking the fourth prime ministerial change in a year as the administration grapples with a growing fiscal deficit.
JAPAN: Japan’s stock markets rose sharply over the week, with the Nikkei 225 Index gaining 4.08% and the broader TOPIX Index up 3.69%, driven by yen weakness that supported the profit outlook for export-heavy industries. The yen depreciated to around JPY 157 against the U.S. dollar, while the yield on the 10-year Japanese government bond rose to a five-week high of 1.1%. Bank of Japan Governor Kazuo Ueda signaled that further interest rate hikes might be necessary if economic conditions improve as expected but emphasized the need for a cautious approach to avoid inflation exceeding the 2% target. Meanwhile, Tokyo’s consumer price index (CPI) rose 3% year-on-year in December, with core CPI up 2.4%, indicating a steady upward trend in inflation. November’s economic data presented a mixed picture: industrial production fell 2.3% after October’s 2.8% rise but beat expectations, retail sales grew a stronger-than-expected 1.8%, and the unemployment rate remained stable at 2.5%.
CHINA: Chinese stocks rose during the holiday-shortened week on hopes of further government stimulus, with the Shanghai Composite Index gaining 0.95%, the blue-chip CSI 300 up 1.36%, and Hong Kong’s Hang Seng Index advancing 1.87%. Reports suggest that Beijing plans to issue a record RMB 3 trillion in special Treasury bonds next year—up sharply from RMB 1 trillion in 2024—to fund initiatives such as subsidies, equipment upgrades, and innovation-driven investments amid concerns of a potential second trade war with the U.S. The People’s Bank of China injected RMB 300 billion into the banking system via its medium-term lending facility while keeping the lending rate at 2%, resulting in a net liquidity withdrawal of RMB 1.15 trillion, the largest since 2014. Meanwhile, industrial profits fell 7.3% year-on-year in November, marking the fourth consecutive monthly decline, though narrower than October’s 10% drop, indicating that stimulus efforts have yet to significantly boost corporate earnings amid ongoing deflationary pressures.
Sources:
>> All index and returns data from Norgate Data and Commodity Systems Incorporated and Wall Street Journal.
>> News from Reuters, Barron’s, Wall St. Journal, Bloomberg.com, ft.com, guggenheimpartners.com, zerohedge.com, ritholtz.com, markit.com, financialpost.com, Eurostat, Statistics Canada, Yahoo! Finance, stocksandnews.com, marketwatch.com, visualcapitalist.com, wantchinatimes.com, BBC, 361capital.com, pensionpartners.com, cnbc.com, FactSet, Morningstar/Ibbotson Associates, Corporate Finance Institute.
>> Commentary from T Rowe Price Global markets weekly update — https://www.troweprice.com/personal-investing/resources/insights/global-markets-weekly-update.html
Disclosures: This material and any mention of specific investments is provided for informational purposes only and is not intended to be investment advice or a recommendation to take any action. The forecasts or forward-looking statements are based on assumptions, may not materialize, and are subject to revision without notice. The market indexes discussed are unmanaged, and generally, considered representative of their respective markets. Index performance is not indicative of the past performance of a particular investment. Indexes do not incur management fees, costs, and expenses. Individuals cannot directly invest in unmanaged indexes. Past performance does not guarantee future results.
