


The very big picture (a historical perspective): The CAPE is now at 34.47– down -0.03% this month.
The long-term valuation of the market is commonly measured by the Cyclically Adjusted Price to Earnings ratio, or “CAPE”, which smooths-out shorter-term earnings swings in order to get a longer-term assessment of market valuation. In the past, the CAPE ratio has proved its importance in identifying potential bubbles and market crashes. An extremely high CAPE ratio means that a company’s stock price is substantially higher than the company’s earnings would indicate and, therefore, overvalued. It is generally expected that the market will eventually correct the company’s stock price by pushing it down to its true value. The historical average of the ratio for the S&P 500 Index is between 15-16, while the highest levels of the ratio have exceeded 30. The record-high levels occurred three times in the history of the U.S. financial markets. The first was in 1929 before the Wall Street crash that signaled the start of the Great Depression. The second was in the late 1990s before the Dotcom Crash, and the third came in 2007 before the 2007-2008 Financial Crisis. https://www.multpl.com/shiller-pe
HISTORY OF THE CAPE VALUE FROM 1871 TO PRESENT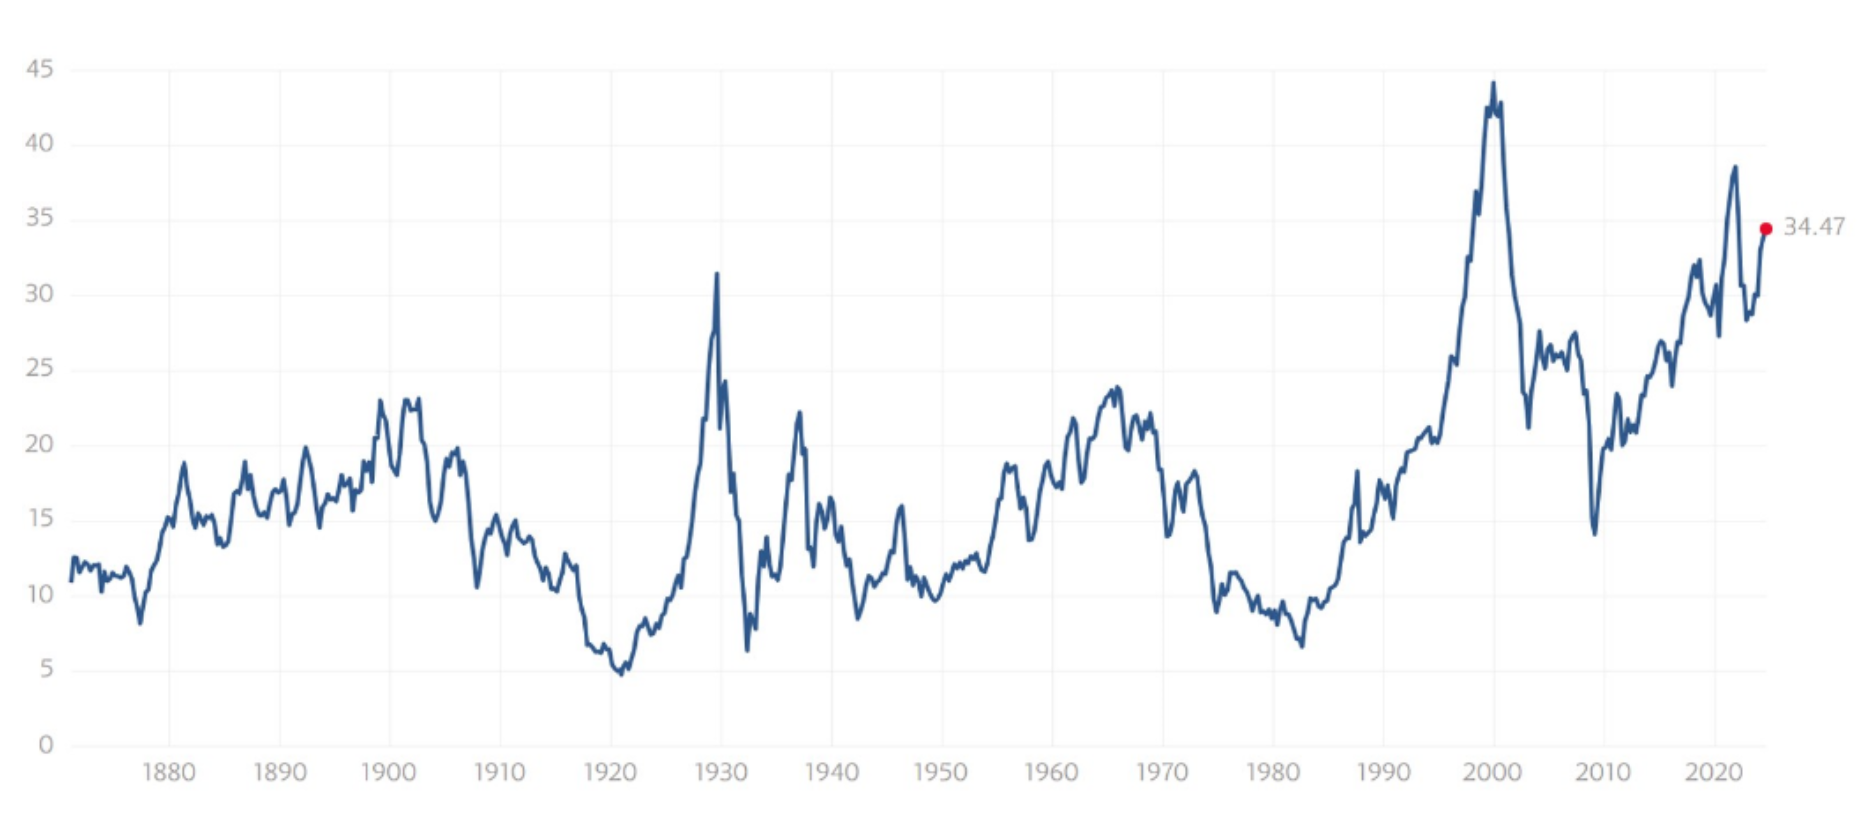
Note: We do not use CAPE as an official input into our methods. However, we think history serves as a guide and that it’s good to know where we are on the historic continuum. https://www.multpl.com/shiller-pe
The big picture: The ‘big picture’ is the (typically) years-long timeframe, the same timeframe in which Cyclical Bulls and Bears operate. The Sherman Portfolios DELTA-V Indicator measuring the Bull/Bear cycle finished the week in BULL status at 69.20, down 5.32% from the prior week’s 73.09. It has signaled Bull since April 21, 2023. The Sherman Portfolios DELTA-V Bond Indicator measuring the Bull/Bear cycle finished the week in BULL status at 66.61, down 0.61% from the prior week’s 67.02 It has signaled Bull since December 15, 2023.
The shorter term picture: GALACTIC SHIELD — POSITIVE entering July 2024 (Q3) indicating positive prospects for equities in the second quarter of 2024. This indicator is based on the combination of U.S. and International Equities trend statuses at the start of each quarter. STARFLUX— NEGATIVE since August 6, 2024 and ended the week at -4.76 (Down 810.45 % last week) This short-term indicator measures U.S. Equities. STARPATH — POSITIVE since November 21, 2023. This indicator measures the interplay on dual timeframes of our Type 1s + the Russell 3000 + our four most ‘pro-cyclical’ Type 3s, vs. Cash.
The complete picture (four indicators across three timeframes): When Three of the Sherman Portfolios indicators are in a POSITIVE status, we read the market as being in a NEUTRAL MARKET.
1. DELTA-V — POSITIVE
2. GALACTIC SHIELD — POSITIVE
3. STARFLUX— NEGATIVE
4. STARPATH — POSITIVE
THIS WEEK IN THE MARKETS
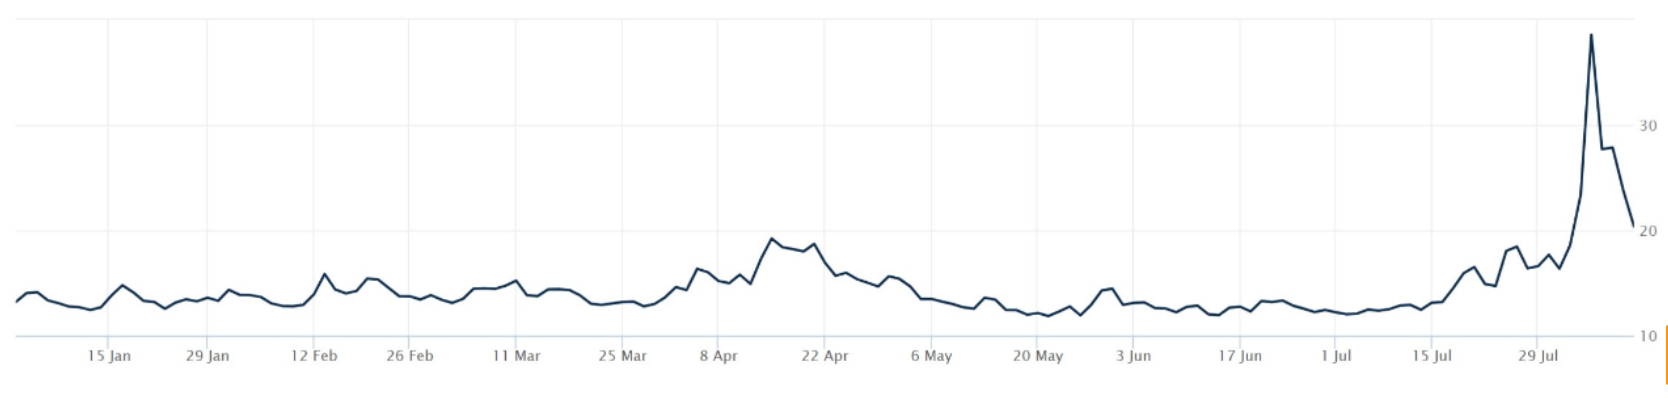
U.S. Markets: Market downturn towards end of week. Yen Carry Crash Monday. The major indexes ended the week slightly lower after bouncing back from the largest sell-off in nearly two years. The S&P 500 came close to correction territory on Monday, dropping 9.71% from its mid-January intraday high, while the Nasdaq Composite had already entered a correction, falling 15.81% from its peak. The CBOE Volatility Index (VIX), Wall Street’s fear gauge, saw sharp fluctuations, spiking to 65.73 on Monday—its highest level since March 2020—before settling at 20.69 by the end of the week. These swings were influenced by technical factors and programmed trading strategies, including a partial unwind of the carry trade triggered by a modest rise in Japanese short-term interest rates, which led investors to pull out of unprofitable positions. However, short covering and stock buybacks provided some support, while the summer vacation season likely added to the volatility by keeping some longer-term investors out of the market.
Looking at the US Indexes:
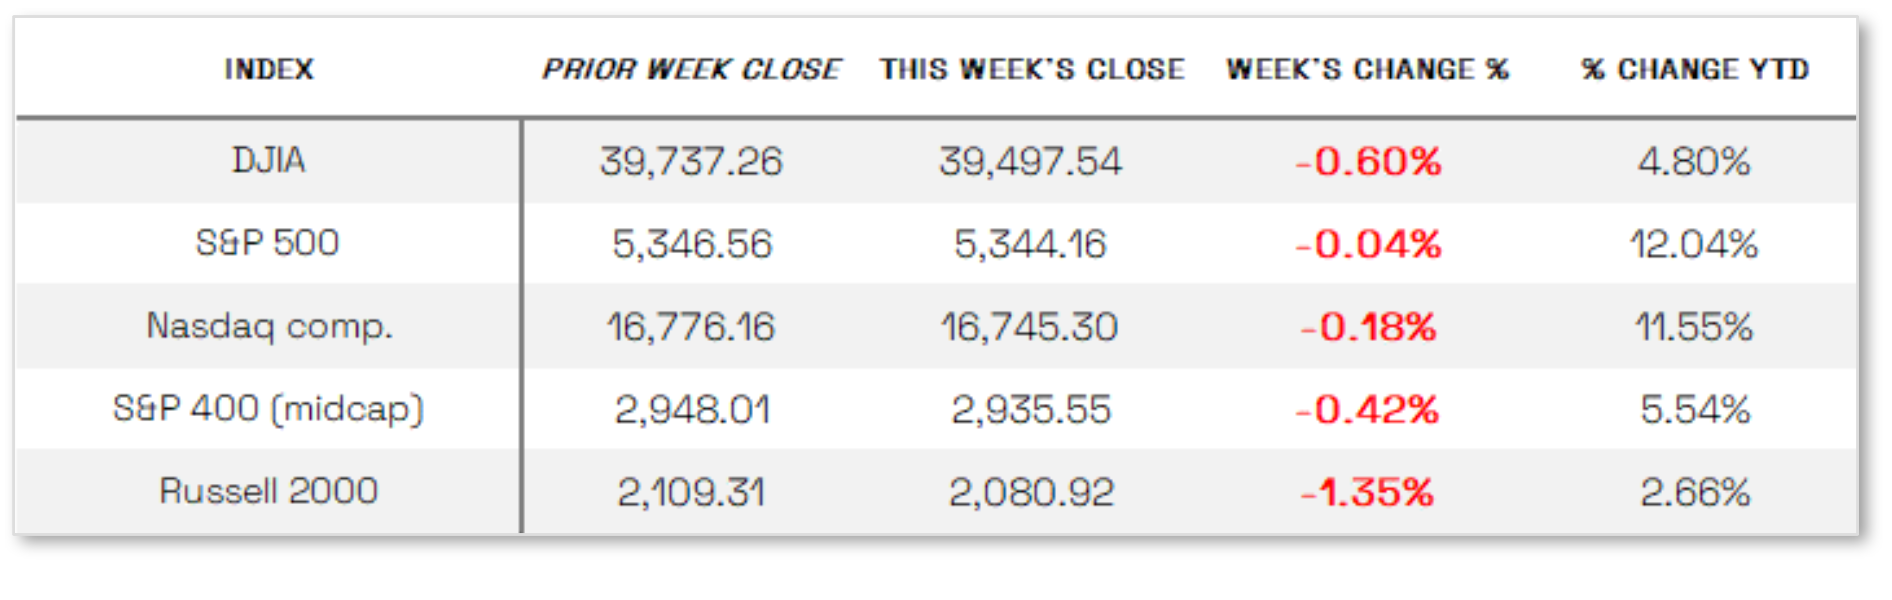
The Dow Jones Industrial Average (DJIA) is the oldest continuing U.S. market index with over 100 years of history and is made up of 30 highly reputable “blue-chip” U.S. stocks (e.g. Coca-Cola Co., Microsoft). The Dow showed a loss this week, ending the week down 0.60% to end at 39,497.54 vs the prior week of 39,737.26
The Nasdaq Composite Index tracks most of the stocks listed on the Nasdaq Stock Market – the second-largest stock exchange in the world. Over half of all stocks on the NASDAQ are tech stocks. The tech-driven Nasdaq showed losses this week. NASDAQ was down 0.18% by closing this week at 16,745.30 vs. the prior week of 16,776.16.
The S&P 500 large-cap index is a market-capitalization-weighted index of 500 leading publicly traded companies in the U.S. The S&P 500 is regarded as one of the best gauges of prominent American equities’ performance, and by extension, that of the stock market overall. The S&P 500 was in the red this week. It was down 0.04%, closing at 5344.16 compared to last week’s 5,346.56.
The S&P 400 mid-cap index is the benchmark index made up of 400 stocks that broadly represent companies with midrange market capitalization between $3.6 billion and $13.1 billion. It is used by investors as a gauge for market performance and directional trends in U.S. stocks. The S&P 400 mid-cap was in the red this week, down 0.42%. It went from last week’s close of 2948.01 to 2935.55.
The Russell 2000 (RUT) small-cap index measures the performance of the 2,000 smaller companies included in the Russell 3000 Index. The Russell 2000 is managed by London’s FTSE Russell Group and is widely regarded as a leading indicator of the U.S. economy because of its focus on smaller companies that focus on the U.S. market. The Russel 2000 was down 1.35% for the week, closing at 2080.92 compared to last week’s 2109.31.
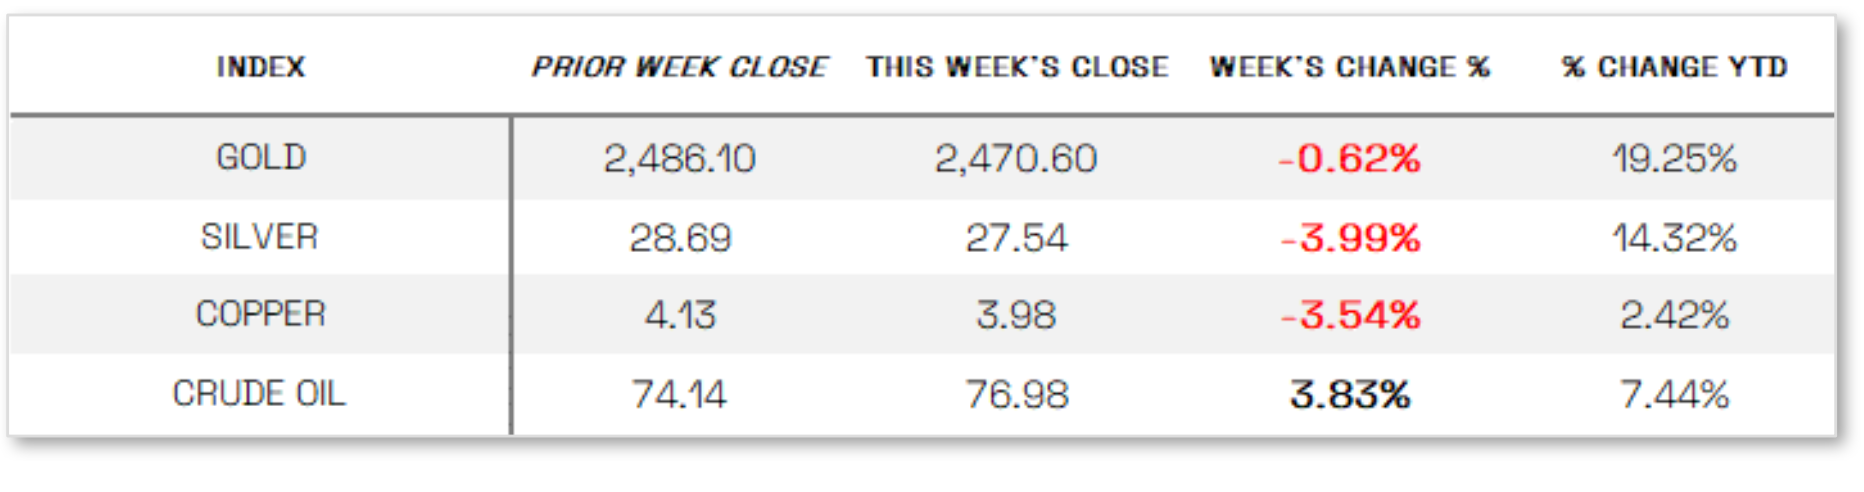
U.S. COMMODITIES / FUTURES OVERVIEW
The Volatility Index (VIX) closed at 20.37 this week, a 12.91% decrease vs last week’s close of 23.39.
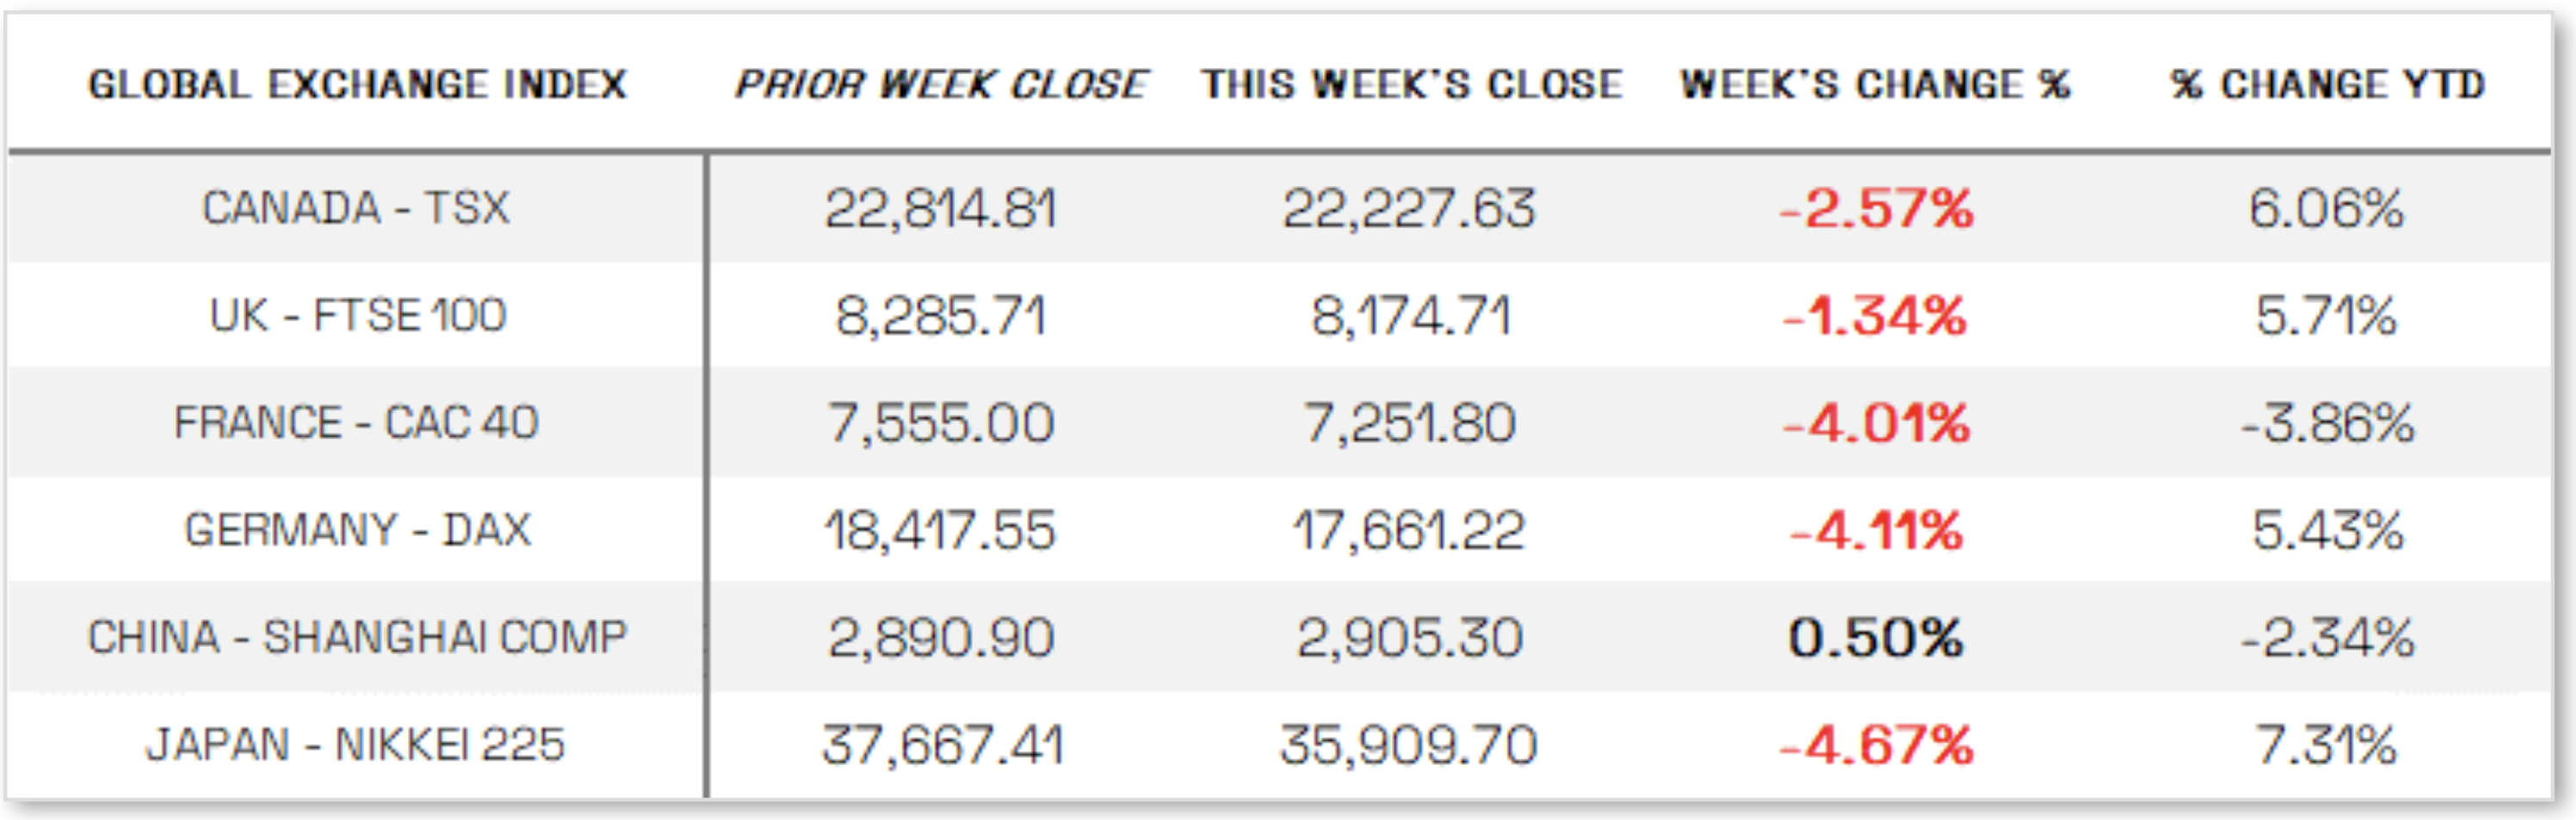
International Markets:
THIS WEEK’S ECONOMIC NEWS
U.S. Economic News: Mixed consumer data: Lingering concerns over the prior week’s disappointing economic data, including an unexpected rise in the unemployment rate and negative manufacturing signals, continued to weigh on the market. Earnings reports from major companies like Airbnb, Marriott, Hilton, Delta, United, and Disney indicated weakening consumer demand, with Yum! Brands also note slower sales at its KFC and Pizza Hut franchises. However, data from S&P Global painted a somewhat brighter picture, as their services sector activity gauge remained in expansion territory despite a slight dip in July, marking its best three-month growth period in two years. Similarly, the Institute for Supply Management’s index rebounded from a contraction in June to a reading of 51.4, signaling growth. A drop in weekly jobless claims to 233,000 from 250,000 helped spark a rally, with the S&P 500 achieving its best daily gain since November 2022, although continuing claims edged up slightly to 1.875 million. Analysts also reassessed the previous week’s unemployment increase, noting that it included newly job-seeking Americans and recent migrants not captured in the weekly claims data.
International Economic News:
EUROPE: The pan-European STOXX Europe 600 Index recovered from sharp losses earlier in the week to close 0.27% higher, with major stock indexes showing mixed results. Germany’s DAX rose 0.35%, France’s CAC 40 gained 0.25%, and the UK’s FTSE 100 remained largely unchanged, while Italy’s FTSE MIB declined by 0.74%. Eurozone government bond yields increased, rebounding from earlier lows as global market concerns about economic growth eased somewhat after a notable drop in U.S. jobless claims. However, eurozone retail sales volumes unexpectedly fell by 0.3% in June, indicating that consumers are still struggling to recover from inflationary pressures, raising concerns about demand in the second quarter. In Germany, industrial output rose 1.4% in June, with orders up 3.9%, surpassing expectations and contrasting with worsening conditions in the manufacturing sector as indicated by the latest purchasing managers’ index. Meanwhile, Germany’s foreign trade surplus shrank to EUR 20.4 billion in June, down from EUR 25.3 billion in May, as exports weakened due to reduced demand from the U.S. and the European Union.
JAPAN: Japan’s stock markets experienced the most severe one-day sell-off in decades at the start of the week, driven by a strengthening yen following the Bank of Japan’s (BoJ) hawkish shift in July, where it raised interest rates and outlined plans to taper bond purchases. Concerns over slowing global growth and the rapid unwinding of the yen carry trade—where investors borrow yen at low rates to invest in higher-yielding foreign markets—further dampened risk appetite, anticipating narrowing U.S.-Japan rate differentials and a stronger yen. However, by week’s end, Japan’s markets had recovered much of the lost ground, with the Nikkei 225 Index and TOPIX Index down 2.46% and 2.1%, respectively. Market volatility was somewhat mitigated by dovish comments from BoJ Deputy Governor Shinichi Uchida, who indicated that the central bank would avoid raising rates in unstable markets, leading to a weakening yen. In the fixed income market, the yield on the 10-year Japanese government bond fell to 0.86% from 0.98% as investors assessed BoJ’s policy outlook. On the economic front, June wage growth exceeded expectations, with headline wages rising 4.5% year-over-year, driven by a sharp increase in summertime bonuses, while scheduled earnings, crucial for BoJ’s wage assessments, also saw an uptick.
CHINA: Chinese stocks declined as concerns over deflationary pressures overshadowed a stronger-than-expected rise in consumer prices. The Shanghai Composite Index dropped 1.48%, while the blue-chip CSI 300 fell 1.56%. In contrast, Hong Kong’s Hang Seng Index gained 0.85%, according to FactSet. China’s consumer price index increased by 0.5% in July, up from 0.2% in June, driven by seasonal factors such as bad weather and a low base for pork prices. However, core inflation, excluding food and energy costs, rose only 0.4%, the lowest growth since January. The producer price index remained in decline, falling 0.8% year-over-year for the 22nd consecutive month. Meanwhile, the Caixin/S&P Global survey showed that services activity edged up to 52.1 in July, indicating continued expansion, but the Caixin composite PMI softened to 51.2 as manufacturing unexpectedly contracted. This mixed data underscored the uneven growth in China’s economy, with a prolonged property slump affecting domestic consumption despite strength in manufacturing and exports. On the trade front, exports rose 7% in July, but this was lower than expected, raising concerns about weakening global demand, which has been crucial for China’s economic performance amid sluggish domestic consumption.
Sources: All index and returns data from Norgate Data and Commodity Systems Incorporated and Wall Street Journal. >> News from Reuters, Barron’s, Wall St. Journal, Bloomberg.com, ft.com, guggenheimpartners.com, zerohedge.com, ritholtz.com, markit.com, financialpost.com, Eurostat, Statistics Canada, Yahoo! Finance, stocksandnews.com, marketwatch.com, visualcapitalist.com, wantchinatimes.com, BBC, 361capital.com, pensionpartners.com, cnbc.com, FactSet, Morningstar/Ibbotson Associates, Corporate Finance Institute. >> Commentary from T Rowe Price Global markets weekly update — https://www.troweprice.com/personal-investing/resources/insights/global-markets-weekly-update
Disclosures: This material is provided for informational purposes only and is not intended to be investment advice or a recommendation to take any action. Past performance cannot guarantee future results.
