


The very big picture (a historical perspective): The CAPE is now at 34.31 – up 0.23% from last week’s value of 34.23. Since 1881, the average annual return for all ten-year periods that began with a CAPE in this range has been slightly positive to slightly negative.
The long-term valuation of the market is commonly measured by the Cyclically Adjusted Price to Earnings ratio, or “CAPE”, which smooths-out shorter-term earnings swings in order to get a longer-term assessment of market valuation. A CAPE level of 30 is considered to be the upper end of the normal range, and the level at which further PE-ratio expansion comes to a halt (meaning that further increases in market prices only occur as a general response to earnings increases, instead of rising “just because”).
HISTORY OF THE CAPE VALUE FROM 1871 TO PRESENT
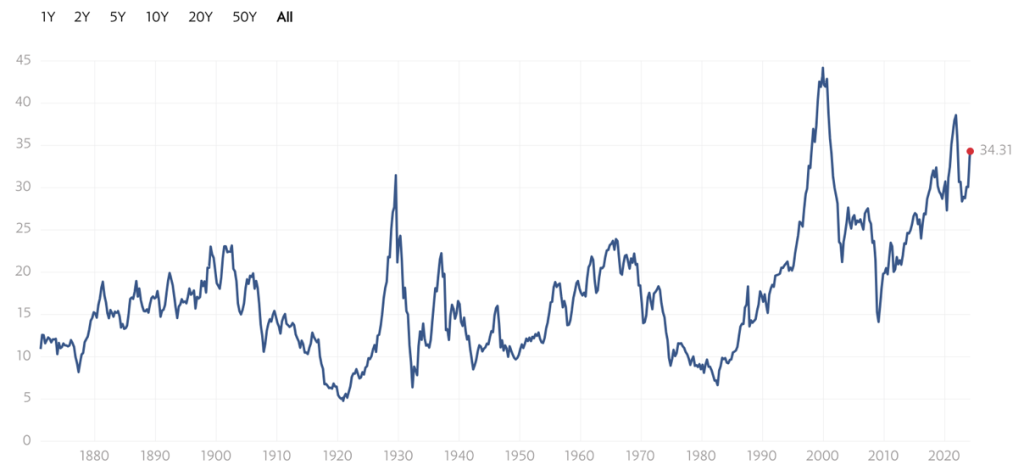
Note: We do not use CAPE as an official input into our methods. However, we think history serves as a guide and that it’s good to know where we are on the historic continuum.
The big picture: The ‘big picture’ is the (typically) years-long timeframe, the same timeframe in which Cyclical Bulls and Bears operate. The Sherman Portfolios DELTA-V Indicator measuring the Bull/Bear cycle finished the week in BULL status at 79.14 up 0.96% from the prior week’s 78.39. We’ve been in a cyclical bull Market since April 21, 2023.
The complete picture (four indicators across three timeframes): When all four of the Sherman Portfolios indicators are in a POSITIVE status, we read the market as being in a CYCLICAL BULL MARKET.
1. DELTA-V — Positive
2. GALACTIC SHIELD — Positive
3. STARFLUX— Positive
4. STARPATH — Positive
In the markets:
U.S. Markets: With many hoping that the Federal Reserve might give stronger indications on their decision to cut interest rates sooner rather than later, we saw strong intraday moves in the market this week. The large-cap S&P 500 Index and mid-cap S&P 400 Index soared to new record intraday highs, joined by the Nasdaq Composite before a pull-back back late on Friday.
While small-cap and value shares outperformed, mega-cap tech shares slowed, with part of the lag coming from a decline in Apple. This comes after reports that iPhone sales in China are slowing.
On Thursday, Tesla was displaced as the 12th biggest public company by market capitalization. The spot is now occupied by the Danish pharmaceuticals company Novo Nordisk, which has seen robust demand for its diabetes and weight loss drugs.
It was an uphill start to the week, beginning on a down note on Tuesday. We saw the S&P 500 fall by more than 1% for the first time since mid-February before recovering on Wednesday. Stocks regained momentum midweek, perhaps due to easing demand and inflation pressures domestically.
Looking at the Indexes: It was a mixed week for the indexes, with the Dow, Nasdaq, and large-cap struggling to maintain its prior week’s gains. Small and mid-cap saw encouraging lifts.
The Dow Jones Industrial Average lost 0.93% this week, closing this week at 38722.69 vs the prior week of 39087.38. The tech-heavy NASDAQ almost completely lost last week’s gains by losing 1.17% this week and closing at 16085.11 vs the prior week of 16274.94. S&P 500 (large cap) lost 0.26%, closing at 5123.69 vs last week’s close of 5,137.08. S&P 400 (mid cap) gained 1.43%, closing at 2952.39 vs its close last week of 2,931. Russell 2000 (small cap) gained a modest 0.30%, closing at 2082.71 over last week’s close of 5,160.
Commodities/Futures: The week was more balanced for commodities / futures, with oil holding mostly steady, and gold, silver & copper enjoying some increases. GOLD (GC00) ended the week at $2,186.20 per ounce vs the prior week of $2,095.70. While steady last week, Gold boasted growth of 4.32% at market close this week. SILVER (SI00) saw nice gains for the week, increasing to a close of $24.55 per ounce – a 5.05% lift over last weeks close of $23.37. COPPER (HG00), saw a miniscule increase over the prior week. This commodity is sometimes viewed as a barometer of world economic health, and showed here to hold steady with slight increase, ending the week up 0.78% at $3.89 per pound vs the prior week of $3.86. CRUDE OIL (CL-1) for April delivery ended the week at $78.01 per barrel, keeping most of its prior week’s gains and declining less than half a dollar. VIX closed at 14.74 this week, a 12.4% increase over last week’s close of 13.11.
International Markets:
| GLOBAL EXCHANGE/index | week CLOSE | % change WEEK | % change ytd |
| CANADA – TSX | 21,737.53 | UP 0.86% | UP 4.15% |
| UK – FTSE 100 | 7,659.74 | DOWN 0.30% | DOWN 0.80% |
| FRANCE – CAC 40 | 8,028.01 | UP 1.18% | UP 6.60% |
| GERMANY – DAX | 17,814.51 | UP 0.45% | UP 6.23% |
| CHINA – SHANGHAI COMP. | 3,046.02 | UP 0.63% | UP 2.83% |
| JAPAN – NIKKEI 225 | 39,688.94 | DOWN 0.56% | UP 19.23% |
The MSCI (Morgan Stanley Capital International) Emerging Markets Index grew by 1.21% for the week closing at 1037.09 vs the prior week of 1024.68, with a YTD growth of 1.21%.
U.S. Economic News: On Wednesday, the Fed reported in its periodic Beige Book survey of regional economic conditions that consumers were showing more sensitivity to rising prices, while the Labor Department said that job openings fell in January to their lowest level in three months. The quits rate — the share of workers leaving jobs voluntarily, typically considered a good measure of workers’ perception of the ease of finding a new job — also fell to its lowest level since August 2020, early in the rebound from the pandemic.
U.S. employers added 275,000 jobs in February, topping the 198,000 economists polled by The Wall Street Journal expected. The unemployment rate ticked up to 3.9%, while wage growth slowed. Recent strong readouts were revised downward.
Some analysts argued that the report shows the Federal Reserve can curb inflation without tipping the economy into a downturn. On Thursday, Fed Chair Jerome Powell said the central bank wasn’t far from being able to cut interest rates.
Powell stated that policymakers were “not far” from having the confidence that inflation’s downtrend will be sustained, enabling them to begin cutting rates. As a result, futures markets ended the week pricing in a somewhat higher (71.0%, according to the CME FedWatch Tool) chance of a cut at the Fed’s policy meeting by June.
Powell’s comments and the downside economic surprises helped push the yield on the benchmark 10-year U.S. Treasury note to its lowest intraday level (4.03%) since February 2. (Bond prices and yields move in opposite directions.) Tax-free municipal bonds lagged Treasuries over the week, bringing the relationship between muni and Treasury yields closer to historical averages. Yet primary issuance was relatively subdued, and the deals that reached the market were met with strong demand.
International Economic News: In local currency terms, the pan-European STOXX Europe 600 Index gained ground for the seventh straight week, hitting a record high on the way to a 1.14% gain. Among the major stock indexes, Italy’s FTSE MIB gained 1.43%, France’s CAC 40 Index added 1.18%, and Germany’s DAX ticked up 0.45%. The UK’s FTSE 100 Index declined 0.30%.
Ten-year government bond yields for Germany, Italy, and France declined after the European Central Bank (ECB) left its monetary policy unchanged and signaled that interest rates could be cut in June.
The central bank now sees inflation falling to 2.0% in 2025, rather than 2026. Projections for core inflation, which excludes volatile food and energy prices, were also revised lower, with the latest update suggesting that it would hit the 2.0% target in 2026. The ECB’s latest forecast cut economic growth to 0.6% in 2024, which was slightly lower. However, it expects growth to accelerate to 1.5% in 2025.
The UK rolls out another payroll tax cut under Chancellor of the Exchequer Jeremy Hunt, in his last Spring Budget before a general election. He unveiled a reduction in national insurance rates that would amount to a GBP 10 billion payroll tax cut which also included changes to child benefit rules that would make them more generous. The Office for Budget Responsibility said that spending cuts of GBP 20 billion were still required to balance the budget. It also said that taxes would climb to 37.1% of gross domestic product (GDP) by 2028–2029, a figure that was lower than the 37.7% predicted in November.
JAPAN: The performance of Japan’s stock markets was mixed over the week, with the Nikkei 225 Index finishing 0.56% lower and the broader TOPIX Index gaining 0.64%. Exuberance around artificial intelligence and solid corporate earnings boosted sentiment.
The yield on the 10-year Japanese government bond rose to 0.73% from 0.71% at the end of the previous week. The yen appreciated sharply to around JPY 147.4 against the U.S. dollar from about 150.1 the prior week. The currency’s strength weighed on Japan’s exporters, as they derive a significant share of their revenues from overseas. Japanese stock markets have been significantly boosted by historic yen weakness over the past three years.
Household spending fell by 6.3% year on year in January, the sharpest decline in nearly three years. Weakness was evident across most categories and notably in auto sales. Inflationary pressure has had the effect of weighing on domestic demand. Conversely, nominal wage growth came in higher than anticipated, with wages rising 2.0% year on year in January versus estimates of 1.2%. Japan’s unions are demanding the highest wage rises in over three decades at this year’s spring shunto negotiations. Finally, the consumer price index for the Tokyo area rose 2.5% year on year in February, in line with expectations.
CHINA: Chinese equities gained as the government’s recent market stabilization measures lifted investor confidence despite an uncertain economic outlook. The Shanghai Composite Index rose 0.63%, while the blue chip CSI 300 added 0.2%. In Hong Kong, the benchmark Hang Seng Index gave up 1.42%, according to FactSet.
Beijing set an economic growth target of around 5% this year at the National People Congress (NPC), China’s parliament, which started March 5 and ends March 11. The target was the same as last year, when China’s economy officially rose 5.2%. However, analysts said it would be hard to match last year’s growth pace, which benefited from a post-lockdown rebound in early 2023.
The government set the budget deficit at around 3%—the same target as early last year until it was subsequently raised to 3.8% to accommodate more borrowing—and said it would issue RMB 1 trillion in special ultra-long central government bonds to support growth.
Chinese exports and imports rose in the first two months of the year. Exports grew an above-consensus 7.1% in January and February from the prior-year period, improving from December’s 2.3% increase. Imports rose 3.5% over the two-month period, greater than the 0.2% gain in December. China combines trade data for the first two months of the year to smooth out distortions arising from the weeklong Lunar New Year holiday.
(Sources: All index- and returns-data from Norgate Data and Commodity Systems Incorporated; news from Reuters, Barron’s, Wall St. Journal, Bloomberg.com, ft.com, guggenheimpartners.com, zerohedge.com, ritholtz.com, markit.com, financialpost.com, Eurostat, Statistics Canada, Yahoo! Finance, stocksandnews.com, marketwatch.com, visualcapitalist.com, wantchinatimes.com, BBC, 361capital.com, pensionpartners.com, cnbc.com, FactSet.)
