


The very big picture (a historical perspective): The CAPE is now at 34.22 – down 0.26% from last week’s value of 34.31. Since 1881, the average annual return for all ten-year periods that began with a CAPE in this range has been slightly positive to slightly negative.
The long-term valuation of the market is commonly measured by the Cyclically Adjusted Price to Earnings ratio, or “CAPE”, which smooths-out shorter-term earnings swings in order to get a longer-term assessment of market valuation. A CAPE level of 30 is considered to be the upper end of the normal range, and the level at which further PE-ratio expansion comes to a halt (meaning that further increases in market prices only occur as a general response to earnings increases, instead of rising “just because”).
HISTORY OF THE CAPE VALUE FROM 1871 TO PRESENT
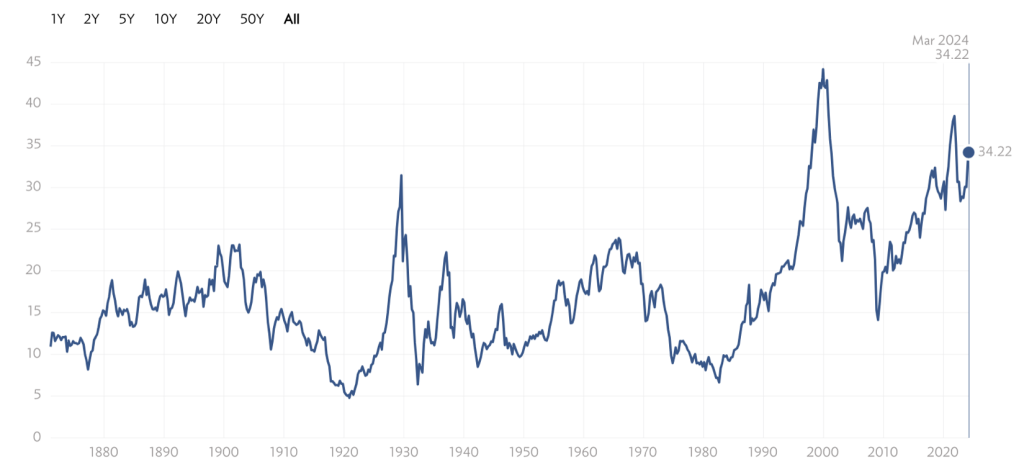
Note: We do not use CAPE as an official input into our methods. However, we think history serves as a guide and that it’s good to know where we are on the historic continuum.
The big picture: The ‘big picture’ is the (typically) years-long timeframe, the same timeframe in which Cyclical Bulls and Bears operate. The Sherman Portfolios DELTA-V Indicator measuring the Bull/Bear cycle finished the week in BULL status at 78.11 DOWN 1.30% from the prior week’s 79.14.
The complete picture (four indicators across three timeframes): When all four of the Sherman Portfolios indicators are in a POSITIVE status, we read the market as being in a CYCLICAL BULL MARKET.
1. DELTA-V — Positive
2. GALACTIC SHIELD — Positive
3. STARFLUX— Positive
4. STARPATH — Positive
In the markets:
U.S. Markets: Stocks were mostly lower for the week, as investors weighed upside surprises in inflation data and signs of moderating consumer spending. The Dow Jones Industrial Average held up best among the major indexes and reached a record high on Wednesday before falling back to end the week. Energy shares outperformed on the back of higher oil prices, while technology shares lagged due to weakness in NVIDIA and other chipmakers.
Markets got off to a generally quiet start to the week, as investors awaited the release of consumer inflation data on Tuesday. The Labor Department’s consumer price index (CPI) rose 0.4% in February, in line with consensus expectations, but core prices (less food and energy) rose a tick more than expected, also by 0.4%. Investors appeared to take the upside core surprise largely in stride, perhaps because it was due in part to a continued increase in shelter costs, generally considered a lagging indicator of overall inflation trends. Apparel costs jumped 0.6% but remained flat over the past 12 months.
Looking at the Indexes: The indexes saw consistent loss across the board. The below 5 indexes all lost some gains, with the S&P500 and Russell 2000 showing the largest losses of the group.
The Dow Jones Industrial Average lost 0.20% this week, not much by percentage loss, but signaling the second consecutive week of downward movement. It closed Mar 15 at 38,714.77 vs the prior week of 38,714.77. The tech-driven index, NASDAQ, also saw its second consecutive week in a downshift, losing 0.70% and closing at 15,973.17. The large-cap S&P 500 lost 1.30%, closing at 5,117.09 vs last week’s close of 5,123.69. S&P 400 mid cap lost 0.97%, closing at 2,923.76 vs its close last week of 2,952.39. After a slow decline last week, the Russell 2000 (small cap) sped up the downward momentum, losing 2.08%, closing at 2,039.32 over last week’s close of 2,082.71.
Commodities/Futures: Futures we mostly up this week, with the exception of Gold. Silver, Copper, and Crude Oil all saw more than a 3% growth each. GOLD (GC00) ended the week at $2,159.40 per ounce vs the prior week of $2,186.20. While steady last week, Gold dropped 1.23% at market close this week. SILVER (SI00) gained again for the second week in a row, increasing to a close of $25.41 per ounce – a 3.50% gain over last weeks close of $24.55. COPPER (HG00), saw a another week’s gains, this time boasting a 5.91% increase over the prior week. This commodity is sometimes viewed as a barometer of world economic health, ending the week up 5.91% at $4.12 per pound vs the prior week of $3.89. CRUDE OIL (CL-1) ended the week at $81.01 per barrel — an increase of 3.85% over last weeks close of $78.01. VIX closed at 14.41 this week, a 2.24% decrease over last week’s close of 14.74. This can be an be an indication that there may be less demand and options prices can start to decline.
International Markets:
| GLOBAL EXCHANGE/index | week CLOSE | % change WEEK | % change ytd |
| CANADA – TSX | 21,849.15 | UP 0.51% | UP 4.68% |
| UK – FTSE 100 | 7,659.74 | UP 0.88% | UP 0.08% |
| FRANCE – CAC 40 | 8,164.35 | UP 1.70% | UP 8.41% |
| GERMANY – DAX | 17,936.65 | UP 0.69% | UP 6.96% |
| CHINA – SHANGHAI COMP. | 3,054.64 | UP 0.28% | UP 3.12% |
| JAPAN – NIKKEI 225 | 38,707.64 | DOWN 2.47% | UP 16.28% |
The MSCI (Morgan Stanley Capital International) Emerging Markets Index lost 0.23% for the week closing at 1,034.74 vs the prior week of 1,037.09, with a YTD growth of 0.98%.
U.S. Economic News: Thursday’s upside producer inflation surprises appeared to cause greater consternation. The producer price index (PPI) rose 0.6% in February, roughly double consensus estimates and the most in six months. While core producer prices rose only 0.3%, this was also slightly more than expected. On a year-over-year basis, headline producer prices were up 1.6%, well above expectations and at the highest level since September. The data appeared to weigh on hopes that low inflation or even deflation in producer prices would eventually flow down to prices paid by consumers.
The stock market’s reaction to the inflation data may have been mitigated by surprising weakness in Thursday’s retail sales report. The Commerce Department reported that retail sales rose 0.6% in February, but the gain missed expectations and was largely due to an increase in gasoline prices (retail sales data are not adjusted for inflation). Notably, online sales also declined 0.1%, marking a sharp deceleration from the 6.4% increase over the past 12 months. Sales at restaurants and bars increased 0.4%, but also at a slower pace, suggesting some growing consumer caution. Indeed, the University of Michigan’s survey of consumer sentiment, released Friday, indicated a modest decline in consumer expectations, with American’s perceiving “few signals that the economy is currently improving or deteriorating,” according to its lead researcher.
The bond market’s reaction to the inflation surprises was more pronounced, with the yield on the benchmark 10-year Treasury note touching its highest intraday level (4.32%) since February 27. (Bond prices and yields move in opposite directions.) Municipals outperformed Treasuries, even as primary issuance volume rose sharply. The largest deals appeared to do well as traders observed strong demand from retail investors.
Traders also noted that investment-grade issuance was heavy at the start of the week and was also largely oversubscribed. Likewise, high yield bond investors appeared to view the hotter-than-expected CPI number as manageable given the technical backdrop of high cash balances and limited new issuance. Investors seemed ready to use any weakness to add positions. However, the market turned lower along with equities amid broad macro headwinds following the release of PPI data.
International Economic News: In local currency terms, the pan-European STOXX Europe 600 Index added 0.31%, notching an eighth consecutive weekly gain. Encouraging corporate earnings and growing hopes that the European Central Bank (ECB) would lower borrowing costs in June stoked the advance. France’s CAC 40 Index rose 1.70%, Italy’s FTSE MIB gained 1.61%, and Germany’s DAX added 0.69%. The UK’s FTSE 100 Index put on 0.94%.
The yield spread between German and Italian benchmark 10-year sovereign bonds narrowed significantly due to growing confidence in Italy’s economic policy and increased demand for high yield debt ahead of a likely reduction in borrowing costs later this year.
The unemployment rate in the UK unexpectedly rose from 3.8% to 3.9% in the three months through January. Wage growth, excluding bonuses, fell to 6.1%, the lowest level since mid-2022. Meanwhile, the UK economy showed signs that it may be recovering from a recession in the second half of 2023. Gross domestic product (GDP) increased 0.2% sequentially in January, bolstered by expansion of retailing and wholesaling. However, GDP fell 0.1% over the three months through January.
Japan’s stock markets generated a negative return over the week, with the Nikkei 225 Index losing 2.5% and the broader TOPIX Index down 2.1%. The likelihood of the Bank of Japan (BoJ) ending its negative interest rate policy in the near term rose with the announcement of the highest average wage rises for members of Japan’s labor unions since the early 1990s. The BoJ is committed to the view that monetary policy tweaks will hinge on the meeting of its 2% inflation target, driven by inflation accompanied by wage growth. Economists’ consensus expectations are now converging around a March or an April interest rate hike.
The BoJ’s ultra-accommodative policy has weighed heavily on the yen, boosting many of the country’s large-cap exporters who derive their revenues from overseas. The yen weakened over the week, to the high end of the JPY 148 against the USD range, from around JPY 147 at the end of the previous week. The yield on the 10-year Japanese government bond rose to 0.79% from a prior 0.73%, hitting its highest level in about three months in anticipation of the BoJ adjusting its monetary policy settings.
BoJ Governor Kazuo Ueda gave a relatively downcast view of the country’s prospects, stating that while the economy is recovering moderately, weakness has been seen in some data. However, economic growth figures released early in the week showed that Japan had in fact averted a technical recession (marked by two successive quarters of negative growth) in the final quarter of last year. Gross domestic product in the fourth quarter of 2023 expanded 0.1% on the quarter compared with the earlier release suggesting the economy had contracted 0.1%. On an annualized basis, this equated to a 0.4% expansion versus a prior fall of 0.4%.
Chinese stocks rose as the government’s recent market stabilization measures boosted investor confidence despite a weak economic outlook. The Shanghai Composite Index gained 0.28%, while the blue chip CSI 300 added 0.71%. In Hong Kong, the benchmark Hang Seng Index rallied 2.25%, according to FactSet.
China’s consumer price index rose an above-consensus 0.7% in February from the prior-year period, reversing January’s 0.8% decline and marking the first positive reading since August 2023 as food and services prices increased and consumption surged during the weeklong Lunar New Year holiday. However, the producer price index fell a bigger-than-expected 2.7% from a year ago, accelerating from January’s 2.5% drop and marking the 17th monthly decline, the longest streak of declines since 2016, according to Bloomberg. Investors remained cautious on calling a trough to deflation as China grapples with weak domestic demand.
The People’s Bank of China injected RMB 387 billion into the banking system via its medium-term lending facility and left the lending rate unchanged at 2.5%, as expected. With RMB 481 billion in loans set to expire this month, the operation resulted in a net withdrawal of RMB 94 billion from the banking system, the first cash extraction through the liquidity instrument since November 2022.
(Sources: All index- and returns-data from Norgate Data and Commodity Systems Incorporated; news from Reuters, Barron’s, Wall St. Journal, Bloomberg.com, ft.com, guggenheimpartners.com, zerohedge.com, ritholtz.com, markit.com, financialpost.com, Eurostat, Statistics Canada, Yahoo! Finance, stocksandnews.com, marketwatch.com, visualcapitalist.com, wantchinatimes.com, BBC, 361capital.com, pensionpartners.com, cnbc.com, FactSet.)
