


The very big picture (a historical perspective):
The long-term valuation of the market is commonly measured by the Cyclically Adjusted Price to Earnings ratio, or “CAPE”, which smooths-out shorter-term earnings swings in order to get a longer-term assessment of market valuation. A CAPE level of 30 is considered to be the upper end of the normal range, and the level at which further PE-ratio expansion comes to a halt (meaning that further increases in market prices only occur as a general response to earnings increases, instead of rising “just because”).
Of course, a “mania” could come along and drive prices higher – much higher, even – and for some years to come. Manias occur when valuation no longer seems to matter, and caution is thrown completely to the wind – as buyers rush in to buy first, and ask questions later. Two manias in the last century – the “Roaring Twenties” of the 1920s, and the “Tech Bubble” of the late 1990s – show that the sky is the limit when common sense is overcome by a blind desire to buy. But, of course, the piper must be paid, and the following decade or two were spent in Secular Bear Markets, giving most or all of the mania-gains back.
See Fig. 1 for the 80-year view of Secular Bulls and Bears.
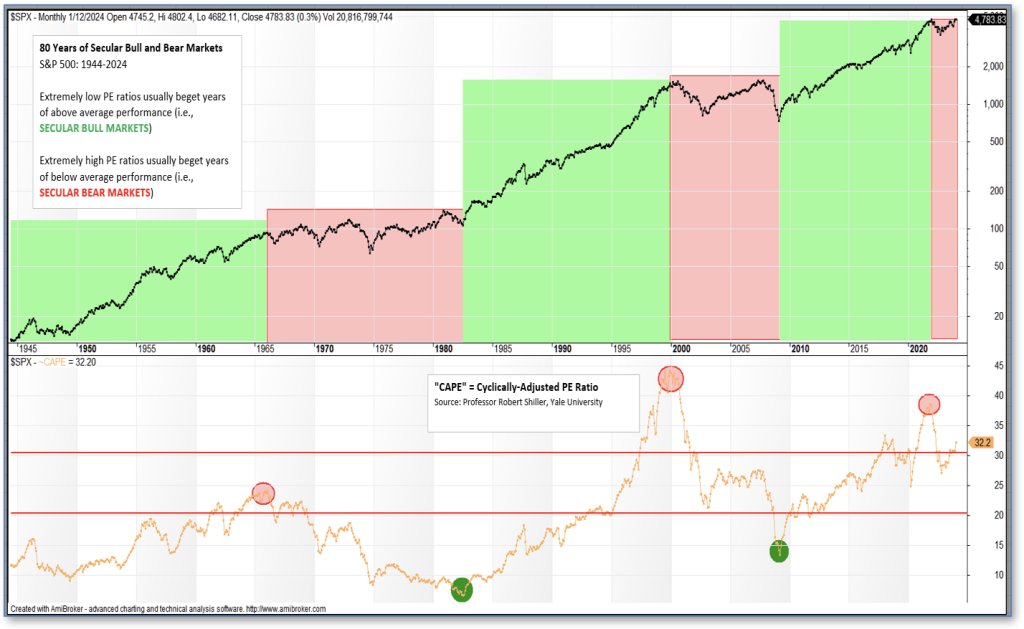
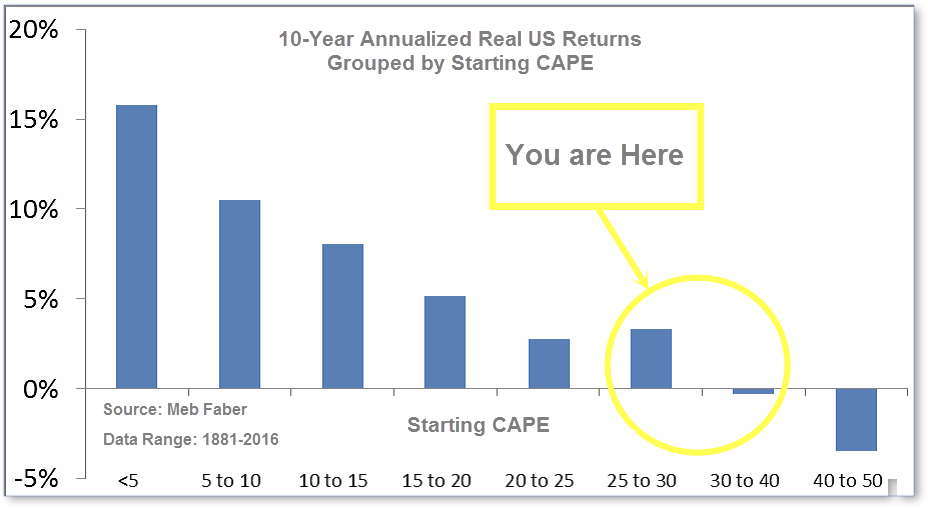
The CAPE is now at 34.25, up from the prior week’s 33.69. Since 1881, the average annual return for all ten-year periods that began with a CAPE in this range has been slightly positive to slightly negative (see Fig. 2).
Note: We do not use CAPE as an official input into our methods. However, if history is any guide – and history is typically ‘some’ kind of guide – it’s always good to simply know where we are on the historic continuum, where that may lead, and what sort of expectations one may wish to hold in order to craft an investment strategy that works in any market ‘season’ … whether the current one, or one that may be ‘coming soon’!
The big picture:
As a reading of our DELTA-V Indicator for U.S. Equities (comparative measurements over a rolling one-year timeframe), we entered a new Cyclical Bull on April 21, 2023.
The complete picture:
Counting-up of the number of all our indicators that are ‘Up’ for U.S. Equities (see Fig. 3), the current tally is that all of the four are Positive, representing a multitude of timeframes (two that can be solely days/weeks, or months+ at a time; another, a quarter at a time; and lastly, the {typically} years-long reading, that being the Cyclical Bull or Bear status).
In the markets:
U.S. Markets:
Throughout a week abbreviated by the Presidents’ Day holiday on Monday, equity indexes mostly trended upwards, although the small-cap Russell 2000 Index experienced some setbacks. Notably, the S&P 500 Index reached fresh intraday highs, mirroring the Nasdaq Composite Index, which saw its most significant daily gain in nearly a year on Thursday. This surge was fueled by NVIDIA, which saw a record increase of USD 277 billion in its market capitalization. The major indexes finished the week predominantly in the green with the Dow Jones Industrial Average adding 1.3% to 39,131 and the technology-heavy NASDAQ Composite adding 1.4% to 15,996. By market cap, the large cap S&P 500 rose 1.7%, while the midcap S&P 400 added 1.1%. The small cap Russell 2000 finished down -0.8%.
International Markets: International markets were predominantly green as well. Canada’s TSX rose 0.7%, while the United Kingdom’s FTSE 100 ended down 0.1%. On Europe’s mainland, France’s CAC 40 and Germany’s DAX added 2.6% and 1.8%, respectively, while in Asia, China’s Shanghai Composite and Japan’s Nikkei gained 4.8% and 1.6%. As grouped by Morgan Stanley Capital International, emerging markets finished up 1.3%. Developed markets ended the week up 1.7%.
Commodities:Precious metals finished the week mixed with Gold rising 1.3% to $2049.40 per ounce and Silver retreating -2.1% to $22.98. Crude oil retraced most of last week’s gain. West Texas Intermediate crude finished the week down -2.5% to $76.49 per barrel. The industrial metal copper, viewed by some analysts as a barometer of world economic health due to its wide variety of uses, ended the week up 1.6%.
U.S. Economic News: If you look at the mid-February statistics, there’s been some positive development for the U.S. labor market. The number of first-time unemployment applications dropped to a five-week low of 201,000, as shown in the graph below from TRADINGECONOMICS. While certainty may be too strong a word, this may come across as a reassuring sign to you that the U.S. labor market still displays some durability, despite ongoing challenges. Over the past few weeks, we’ve seen jobless claims hold at a low range, spanning from 189,000 to 227,000. Looking at this in light of recent history, this is an impressively low range as we watch the new year unfold. In addition to what we’re seeing and based on seasonally adjusted data, various economists are projecting that new unemployment claims will continue to hover around 216,000 as seen at the close of the week ending on February 17. When we zoom out to look at the broader picture, unemployment remains at historically low levels and a strong continuation of consumer spending would likely safeguard the economy against recession until the anticipated interest rate cuts later in the year. “The only thing that’s changed in the labor market in the past few weeks is that the Fed has suggested it doesn’t need to see it weaken significantly to cut interest rates,” said E-Trade’s managing director of trading and investing Chris Larkin. “But it remains to be seen if the Fed will be as relaxed about the jobs market if we continue to see a steady stream of hot economic data and rising inflation readings,” added Larkin.
In February, a pair of S&P surveys indicated there are no significant red flags on our horizon. The S&P flash U.S. manufacturing purchasing managers index (PMI) surged to a 17-month high of 51.5, strengthened by an uptick in new orders, which marked the strongest increase in over a year and a half. Meanwhile, the S&P flash U.S. services PMI dipped to a three-month low of 51.3 but remained in positive territory. These surveys are the first pulse-checks of each month on the health of the economy and give us a glance into its recent performance. What the S&P Global report seemed to show us this month, as visualized in the charts below, is a picture of steady, though modest, growth with some potential improvement. New orders, which we often perceive as an indication of future sales, experienced an uptick among manufacturers while remaining stable at service firms. Should this rebound continue among manufacturers, it could have positive ripple effects on the broader service side of the economy. When we look at the downside, the pace of hiring saw only a modest increase this month, according to S&P. Businesses reported that the prices they paid for supplies, which tend to cascade down to the prices we see on the shelf, rose at the slowest rate since 2020 during the month of February. “The early PMI data for February indicate that the U.S. economy continued to expand midway through the first quarter, pointing to annualized GDP growth in the region of 2%,” said S&P business economist Chris Williamson.
In January, we saw a boost in home sales as buyers seized the opportunity presented by mortgage rates dipping below 7% at the beginning of the year. According to recent data from the National Association of Realtors (NAR), sales of previously owned homes climbed by 3.1% to reach an annual rate of 4 million in January. If you glance at the NAR’s visual below, the median price for an existing home increased by 5.1% to $379,100, in contrast to the same month last year. What’s more, we’ve seen home prices outpacing wage growth, with a notable 4.5% increase observed on a yearly basis as of January. While prices have climbed, they still haven’t reached the peak we saw in June 2022. However, homes you may have seen listed for sale probably spent an average of 36 days on the market, compared to 29 days in the previous month, indicating a slight slowdown in the pace of sales. Sales of existing homes showed a positive trend nationwide, with the West region leading the pack with a 4.3% increase in sales. We saw the median price of a home in this region reach $572,100. “Of course, the next move in mortgage rates will be higher, so January’s firming may last another month or two (especially since existing-home sales are recorded at contract closing) but seems likely to dissipate by the spring,” Stephen Stanley, the chief U.S. economist at Santander U.S. Capital Markets, wrote in a note.
If you recall anticipating rate cuts to kick off in March, you were probably disappointed when economists further suspended their forecasts for the initial rate cut as late as May or June. The Federal Reserve’s policy meeting in late January showed us that more officials are concerned about cutting interest rates too quickly, rather than too slowly. Federal Reserve officials said that there was uncertainty over the duration a restrictive policy stance needed to be maintained. Former Treasury Secretary, Larry Summers, sees a small chance that the next move will be a rate hike. “If the central bank waits for clear signs that the labor market, or the broader economy, is deteriorating, they will be behind the curve,” said Ryan Sweet, chief U.S. economist at Oxford Economics. Sweet added that he was worried the Fed’s stance “could turn a soft landing into a bumpier one.”
International Economic News: Canadians were pleasantly surprised as the inflation rate dropped more than expected, signaling a welcome slowdown in price growth across various sectors of the economy. According to recent data from Statistics Canada, the annual inflation rate fell from 3.4% in December to 2.9% in January, a notable shift highlighted in the visual representation below. This significant decline in inflation was largely attributed to a 4% annualized decrease in gasoline prices, providing relief for consumers and contributing to the overall moderation in price levels. Douglas Porter, the chief economist at BMO, was quick to express his delight, describing the latest inflation report as a “very pleasant surprise.” Prime Minister Justin Trudeau echoed this sentiment, referring to the figures as “good news” and expressing optimism about potential interest rate cuts by the Bank of Canada. “We are optimistic that the Bank of Canada will start bringing down interest rates sometime this year, hopefully sooner rather than later. But that is their decision to make,” Trudeau said during a housing announcement with B.C. Premier David Eby in Vancouver. The prospect of lower interest rates offers a glimmer of hope amidst ongoing economic uncertainties for Canadians.
Britain’s economy has seen some positive momentum as we head further into 2024. A recent survey from S&P Global has revealed strong growth among services firms, with business optimism reaching a two-year high. However, despite these positive improvements, inflation pressures are expected to keep the Bank of England cautious about reducing borrowing costs. The preliminary February S&P Global/CIPS UK Composite Purchasing Managers’ Index (PMI), which covers both services and manufacturing firms, climbed to 53.3, marking the highest level in nine months. This uptick adds to the growing evidence that Britain’s shallow recession experienced last year is likely to be short-lived. The survey findings revealed that average cost burdens saw a notable increase in February, marking the fastest pace in six months. This uptick was primarily driven by higher labor costs and escalating freight expenses for manufacturers, attributed to the Red Sea crisis. Despite these challenges, there was a positive trend in new business, showing the quickest growth since May of the previous year. However, it’s worth noting that companies remained cautious about expanding their workforce due to the significant uptick in pay. As portrayed in the visual from S&P Global, the preliminary PMI survey shows us some underlying resilience, and the potential for further growth in the British economy.
On Europe’s mainland, Germany’s gross domestic product is now expected to grow by just 0.2% this year, as the country wades in “tricky waters,” German Economy Minister Robert Habeck said. When we look at the revised GDP growth forecast it has declined from a previous estimate of 1.3%. Speaking during a news briefing, the minister attributed the revised forecast to an unstable global economic environment and to the low growth of world trade, alongside higher interest rates. Those issues have negatively impacted investments, especially in the construction industry, he said. The country narrowly avoided a recession in the second half of 2023, despite its GDP declining by 0.3% in the final quarter as well as for the full-year 2023. Habeck said the government now anticipates German GDP to increase by 1% in 2025.
As we look into the economic landscape in Asia, analysts suggest that China is likely to continue with a gradual approach to stimulating its economy, even though recent policy moves haven’t had a significant impact on market sentiment. Just earlier this week, China made its largest-ever reduction in the benchmark mortgage rate, but it didn’t quite make waves in the markets. Howe Chung Wan, who is the head of Asia fixed income at Principal Asset Management, believes that Chinese policymakers will take a more measured approach. “Policy makers are focused on addressing the medium-term structural issues in debt, property, and other parts of the economy where leverage is overextended,” said Wan. At the same time, policymakers are keen on preventing the economy from spiraling out of control. They aim to do this by implementing targeted measures to support the cyclical nature of the Chinese economy, without resorting to major support measures. “Hence, no major big support measures expected,” Wan said.
This week, Japan’s benchmark Nikkei 225 index made headlines by soaring past its highest level since 1989, closing Thursday at 39,098. Its previous record of 38,915 was set on December 29, 1989, during Japan’s post-war boom. However, unlike the economic boom of the past, Japan’s current economy is facing challenges, with no signs of a financial bubble. Despite this, we can see that the market has logged significant gains in recent months, fueled by strong interest from foreign investors who make up the majority of trading volume on the Tokyo exchange. Additionally, the Bank of Japan’s easy money policies have contributed to the market’s momentum.
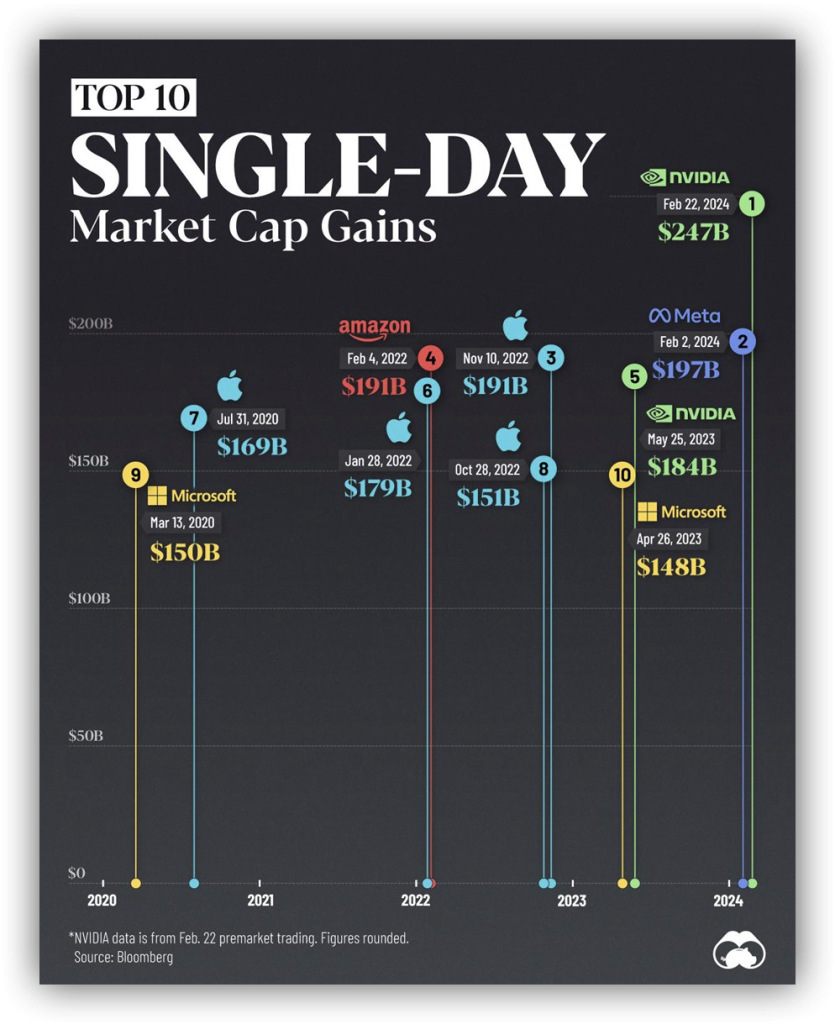
Finally: This week, semiconductor behemoth Nvidia reported blowout earnings that beat even the most sky-high expectations. Nvidia climbed about 16% hitting a record high—and added $277 billion to its market cap—the largest single day increase ever. When you look at the visual below, you’ll see that the top five large cap single-day gains have all been made in the last two years. To put that massive gain in perspective, about this time last year the average market cap of an S&P 500 company was $30.4 billion.
(Sources: All index- and returns-data from Norgate Data and Commodity Systems Incorporated; news from Reuters, Barron’s, Wall St. Journal, Bloomberg.com, ft.com, guggenheimpartners.com, zerohedge.com, ritholtz.com, markit.com, financialpost.com, Eurostat, Statistics Canada, tradingeconomics.com, Yahoo! Finance, stocksandnews.com, marketwatch.com, visualcapitalist.com, wantchinatimes.com, BBC, 361capital.com, pensionpartners.com, cnbc.com, FactSet.)
